Czech vs Immigrants from Belarus Unemployment Among Ages 60 to 64 years
COMPARE
Czech
Immigrants from Belarus
Unemployment Among Ages 60 to 64 years
Unemployment Among Ages 60 to 64 years Comparison
Czechs
Immigrants from Belarus
4.4%
UNEMPLOYMENT AMONG AGES 60 TO 64 YEARS
100.0/ 100
METRIC RATING
26th/ 347
METRIC RANK
5.0%
UNEMPLOYMENT AMONG AGES 60 TO 64 YEARS
6.4/ 100
METRIC RATING
228th/ 347
METRIC RANK
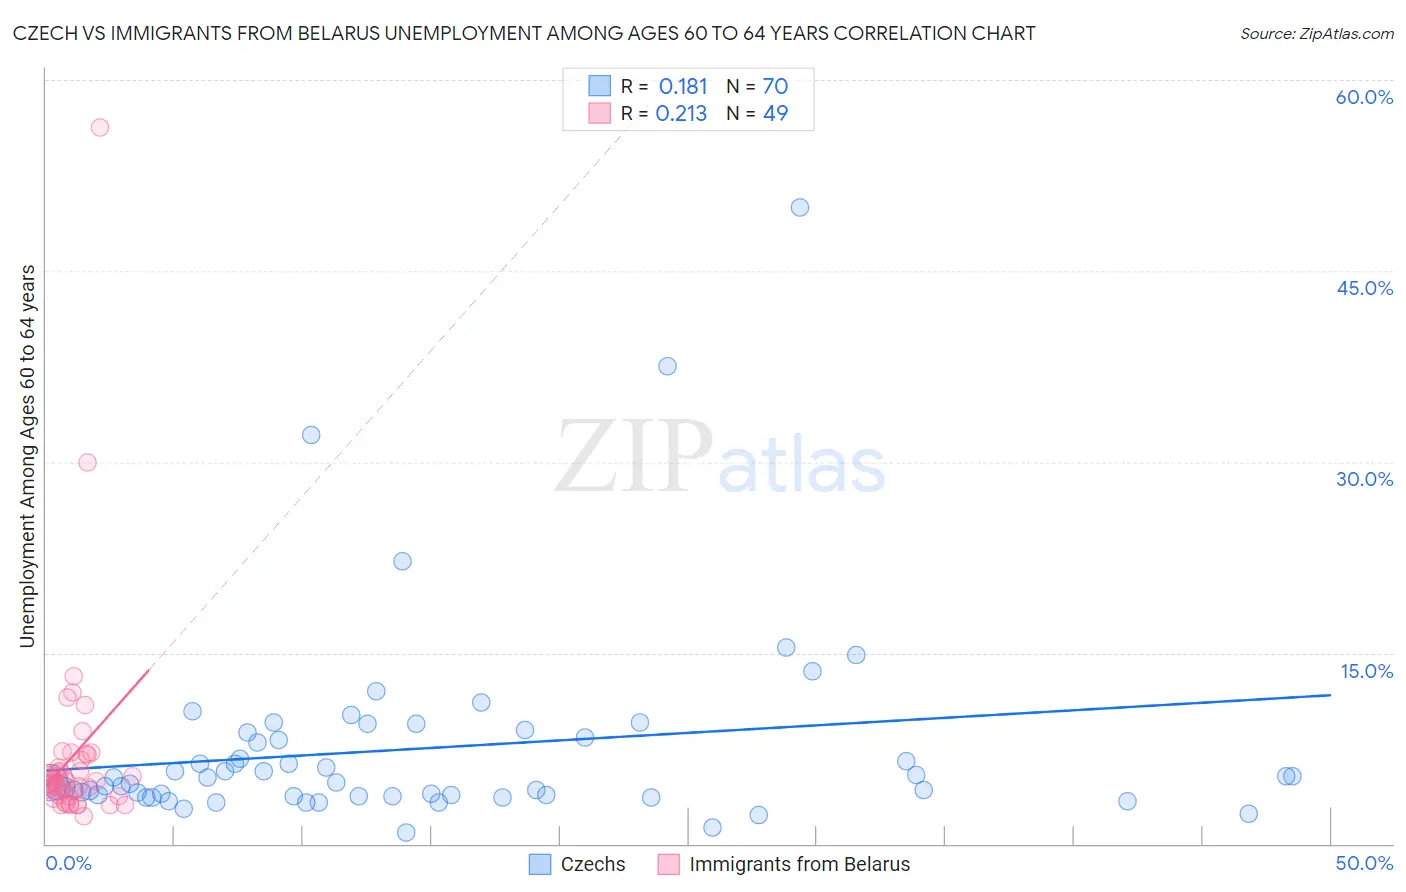
Czech vs Immigrants from Belarus Unemployment Among Ages 60 to 64 years Correlation Chart
The statistical analysis conducted on geographies consisting of 416,417,760 people shows a poor positive correlation between the proportion of Czechs and unemployment rate among population between the ages 60 and 64 in the United States with a correlation coefficient (R) of 0.181 and weighted average of 4.4%. Similarly, the statistical analysis conducted on geographies consisting of 144,606,203 people shows a weak positive correlation between the proportion of Immigrants from Belarus and unemployment rate among population between the ages 60 and 64 in the United States with a correlation coefficient (R) of 0.213 and weighted average of 5.0%, a difference of 11.7%.
Unemployment Among Ages 60 to 64 years Correlation Summary
| Measurement | Czech | Immigrants from Belarus |
| Minimum | 0.87% | 2.2% |
| Maximum | 50.0% | 56.3% |
| Range | 49.1% | 54.1% |
| Mean | 7.5% | 6.9% |
| Median | 4.8% | 4.9% |
| Interquartile 25% (IQ1) | 3.7% | 3.7% |
| Interquartile 75% (IQ3) | 8.3% | 6.8% |
| Interquartile Range (IQR) | 4.6% | 3.0% |
| Standard Deviation (Sample) | 7.9% | 8.4% |
| Standard Deviation (Population) | 7.9% | 8.3% |
Similar Demographics by Unemployment Among Ages 60 to 64 years
Demographics Similar to Czechs by Unemployment Among Ages 60 to 64 years
In terms of unemployment among ages 60 to 64 years, the demographic groups most similar to Czechs are Immigrants from Iraq (4.5%, a difference of 0.080%), Yugoslavian (4.4%, a difference of 0.10%), Immigrants from Nepal (4.5%, a difference of 0.16%), Cuban (4.5%, a difference of 0.39%), and Immigrants from Venezuela (4.5%, a difference of 0.41%).
| Demographics | Rating | Rank | Unemployment Among Ages 60 to 64 years |
| Tsimshian | 100.0 /100 | #19 | Exceptional 4.4% |
| Afghans | 100.0 /100 | #20 | Exceptional 4.4% |
| Immigrants | Cabo Verde | 100.0 /100 | #21 | Exceptional 4.4% |
| Cape Verdeans | 100.0 /100 | #22 | Exceptional 4.4% |
| Immigrants | Zaire | 100.0 /100 | #23 | Exceptional 4.4% |
| Immigrants | Burma/Myanmar | 100.0 /100 | #24 | Exceptional 4.4% |
| Yugoslavians | 100.0 /100 | #25 | Exceptional 4.4% |
| Czechs | 100.0 /100 | #26 | Exceptional 4.4% |
| Immigrants | Iraq | 100.0 /100 | #27 | Exceptional 4.5% |
| Immigrants | Nepal | 100.0 /100 | #28 | Exceptional 4.5% |
| Cubans | 100.0 /100 | #29 | Exceptional 4.5% |
| Immigrants | Venezuela | 100.0 /100 | #30 | Exceptional 4.5% |
| Immigrants | Eritrea | 100.0 /100 | #31 | Exceptional 4.5% |
| Zimbabweans | 100.0 /100 | #32 | Exceptional 4.5% |
| Carpatho Rusyns | 100.0 /100 | #33 | Exceptional 4.5% |
Demographics Similar to Immigrants from Belarus by Unemployment Among Ages 60 to 64 years
In terms of unemployment among ages 60 to 64 years, the demographic groups most similar to Immigrants from Belarus are Nigerian (5.0%, a difference of 0.050%), Immigrants from Chile (5.0%, a difference of 0.060%), African (5.0%, a difference of 0.070%), Immigrants from Denmark (5.0%, a difference of 0.10%), and Tohono O'odham (5.0%, a difference of 0.10%).
| Demographics | Rating | Rank | Unemployment Among Ages 60 to 64 years |
| Ugandans | 10.5 /100 | #221 | Poor 4.9% |
| Brazilians | 10.1 /100 | #222 | Poor 5.0% |
| Crow | 9.7 /100 | #223 | Tragic 5.0% |
| Immigrants | Cameroon | 8.5 /100 | #224 | Tragic 5.0% |
| Immigrants | Ireland | 7.2 /100 | #225 | Tragic 5.0% |
| Immigrants | Chile | 6.8 /100 | #226 | Tragic 5.0% |
| Nigerians | 6.8 /100 | #227 | Tragic 5.0% |
| Immigrants | Belarus | 6.4 /100 | #228 | Tragic 5.0% |
| Africans | 5.9 /100 | #229 | Tragic 5.0% |
| Immigrants | Denmark | 5.8 /100 | #230 | Tragic 5.0% |
| Tohono O'odham | 5.7 /100 | #231 | Tragic 5.0% |
| Immigrants | Eastern Asia | 4.7 /100 | #232 | Tragic 5.0% |
| Immigrants | Greece | 4.6 /100 | #233 | Tragic 5.0% |
| Iranians | 4.2 /100 | #234 | Tragic 5.0% |
| Delaware | 3.6 /100 | #235 | Tragic 5.0% |