Burmese vs Immigrants from Belarus 2nd Grade
COMPARE
Burmese
Immigrants from Belarus
2nd Grade
2nd Grade Comparison
Burmese
Immigrants from Belarus
98.0%
2ND GRADE
81.0/ 100
METRIC RATING
142nd/ 347
METRIC RANK
97.8%
2ND GRADE
41.5/ 100
METRIC RATING
184th/ 347
METRIC RANK
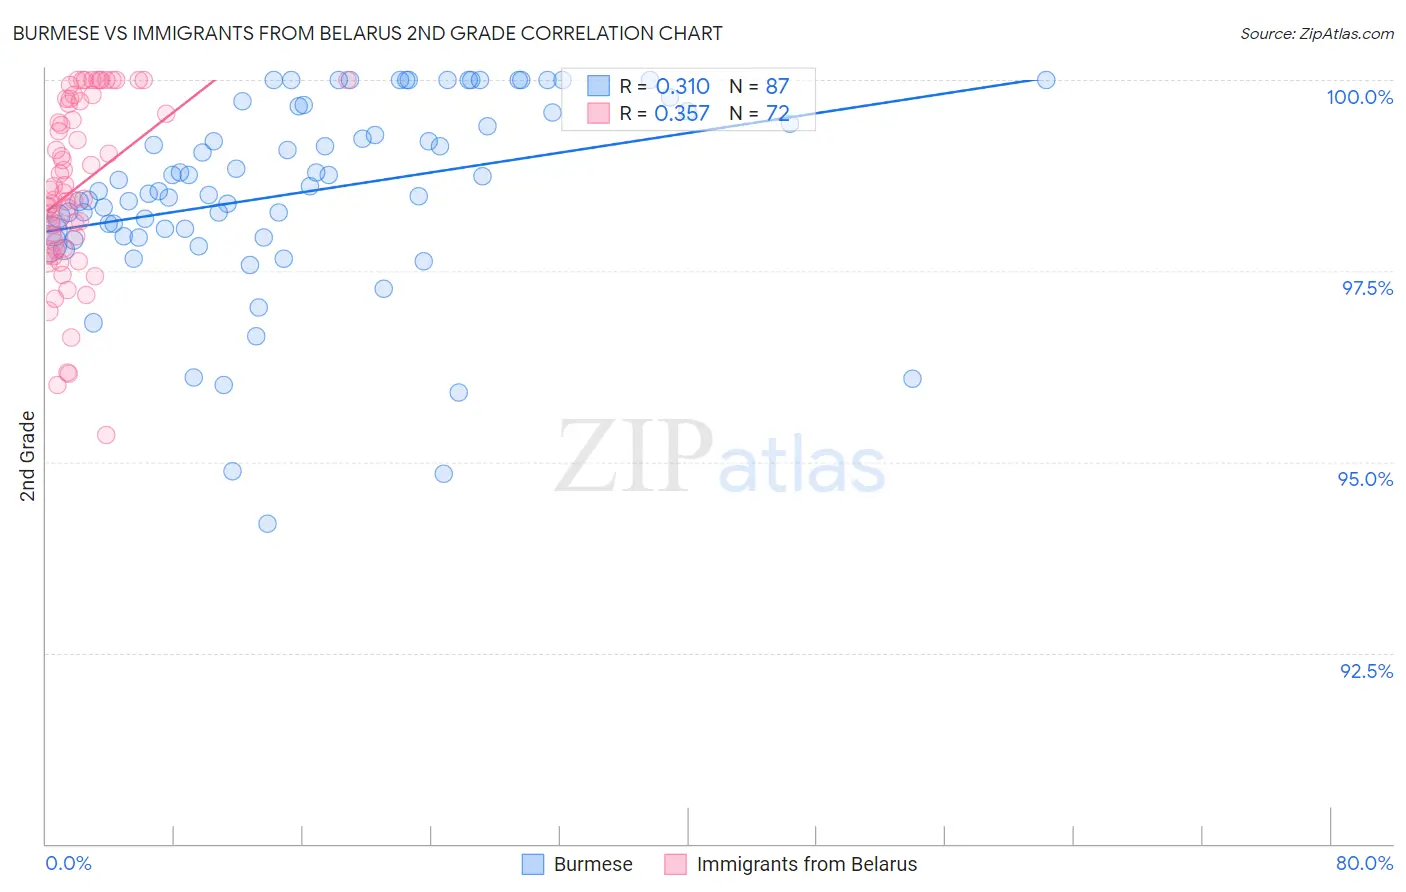
Burmese vs Immigrants from Belarus 2nd Grade Correlation Chart
The statistical analysis conducted on geographies consisting of 465,408,311 people shows a mild positive correlation between the proportion of Burmese and percentage of population with at least 2nd grade education in the United States with a correlation coefficient (R) of 0.310 and weighted average of 98.0%. Similarly, the statistical analysis conducted on geographies consisting of 149,993,317 people shows a mild positive correlation between the proportion of Immigrants from Belarus and percentage of population with at least 2nd grade education in the United States with a correlation coefficient (R) of 0.357 and weighted average of 97.8%, a difference of 0.14%.
2nd Grade Correlation Summary
| Measurement | Burmese | Immigrants from Belarus |
| Minimum | 94.2% | 95.4% |
| Maximum | 100.0% | 100.0% |
| Range | 5.8% | 4.6% |
| Mean | 98.5% | 98.6% |
| Median | 98.5% | 98.5% |
| Interquartile 25% (IQ1) | 98.0% | 97.8% |
| Interquartile 75% (IQ3) | 99.6% | 99.7% |
| Interquartile Range (IQR) | 1.6% | 1.9% |
| Standard Deviation (Sample) | 1.3% | 1.1% |
| Standard Deviation (Population) | 1.3% | 1.1% |
Similar Demographics by 2nd Grade
Demographics Similar to Burmese by 2nd Grade
In terms of 2nd grade, the demographic groups most similar to Burmese are Alsatian (98.0%, a difference of 0.0%), Immigrants from Turkey (98.0%, a difference of 0.010%), Hmong (98.0%, a difference of 0.010%), Filipino (98.0%, a difference of 0.010%), and Immigrants from Israel (98.0%, a difference of 0.010%).
| Demographics | Rating | Rank | 2nd Grade |
| Immigrants | Bulgaria | 89.7 /100 | #135 | Excellent 98.0% |
| Immigrants | Kuwait | 89.2 /100 | #136 | Excellent 98.0% |
| Immigrants | Romania | 88.3 /100 | #137 | Excellent 98.0% |
| Israelis | 87.9 /100 | #138 | Excellent 98.0% |
| Blackfeet | 87.5 /100 | #139 | Excellent 98.0% |
| Palestinians | 83.9 /100 | #140 | Excellent 98.0% |
| Immigrants | Turkey | 83.0 /100 | #141 | Excellent 98.0% |
| Burmese | 81.0 /100 | #142 | Excellent 98.0% |
| Alsatians | 80.5 /100 | #143 | Excellent 98.0% |
| Hmong | 80.0 /100 | #144 | Good 98.0% |
| Filipinos | 79.2 /100 | #145 | Good 98.0% |
| Immigrants | Israel | 78.0 /100 | #146 | Good 98.0% |
| Immigrants | Greece | 76.8 /100 | #147 | Good 98.0% |
| Jordanians | 74.5 /100 | #148 | Good 98.0% |
| Apache | 74.0 /100 | #149 | Good 97.9% |
Demographics Similar to Immigrants from Belarus by 2nd Grade
In terms of 2nd grade, the demographic groups most similar to Immigrants from Belarus are Portuguese (97.8%, a difference of 0.0%), Immigrants from Poland (97.8%, a difference of 0.0%), Immigrants from Argentina (97.8%, a difference of 0.0%), Immigrants from Venezuela (97.9%, a difference of 0.010%), and Native/Alaskan (97.9%, a difference of 0.010%).
| Demographics | Rating | Rank | 2nd Grade |
| Immigrants | Brazil | 46.6 /100 | #177 | Average 97.9% |
| Argentineans | 46.3 /100 | #178 | Average 97.9% |
| Immigrants | Venezuela | 46.1 /100 | #179 | Average 97.9% |
| Natives/Alaskans | 44.3 /100 | #180 | Average 97.9% |
| Egyptians | 44.3 /100 | #181 | Average 97.9% |
| Portuguese | 42.4 /100 | #182 | Average 97.8% |
| Immigrants | Poland | 42.2 /100 | #183 | Average 97.8% |
| Immigrants | Belarus | 41.5 /100 | #184 | Average 97.8% |
| Immigrants | Argentina | 40.6 /100 | #185 | Average 97.8% |
| Arabs | 36.9 /100 | #186 | Fair 97.8% |
| Pakistanis | 36.1 /100 | #187 | Fair 97.8% |
| Immigrants | Kazakhstan | 35.6 /100 | #188 | Fair 97.8% |
| Panamanians | 33.5 /100 | #189 | Fair 97.8% |
| Immigrants | Taiwan | 31.8 /100 | #190 | Fair 97.8% |
| Paraguayans | 30.8 /100 | #191 | Fair 97.8% |