Czech vs Carpatho Rusyn 11th Grade
COMPARE
Czech
Carpatho Rusyn
11th Grade
11th Grade Comparison
Czechs
Carpatho Rusyns
94.4%
11TH GRADE
100.0/ 100
METRIC RATING
23rd/ 347
METRIC RANK
94.8%
11TH GRADE
100.0/ 100
METRIC RATING
5th/ 347
METRIC RANK
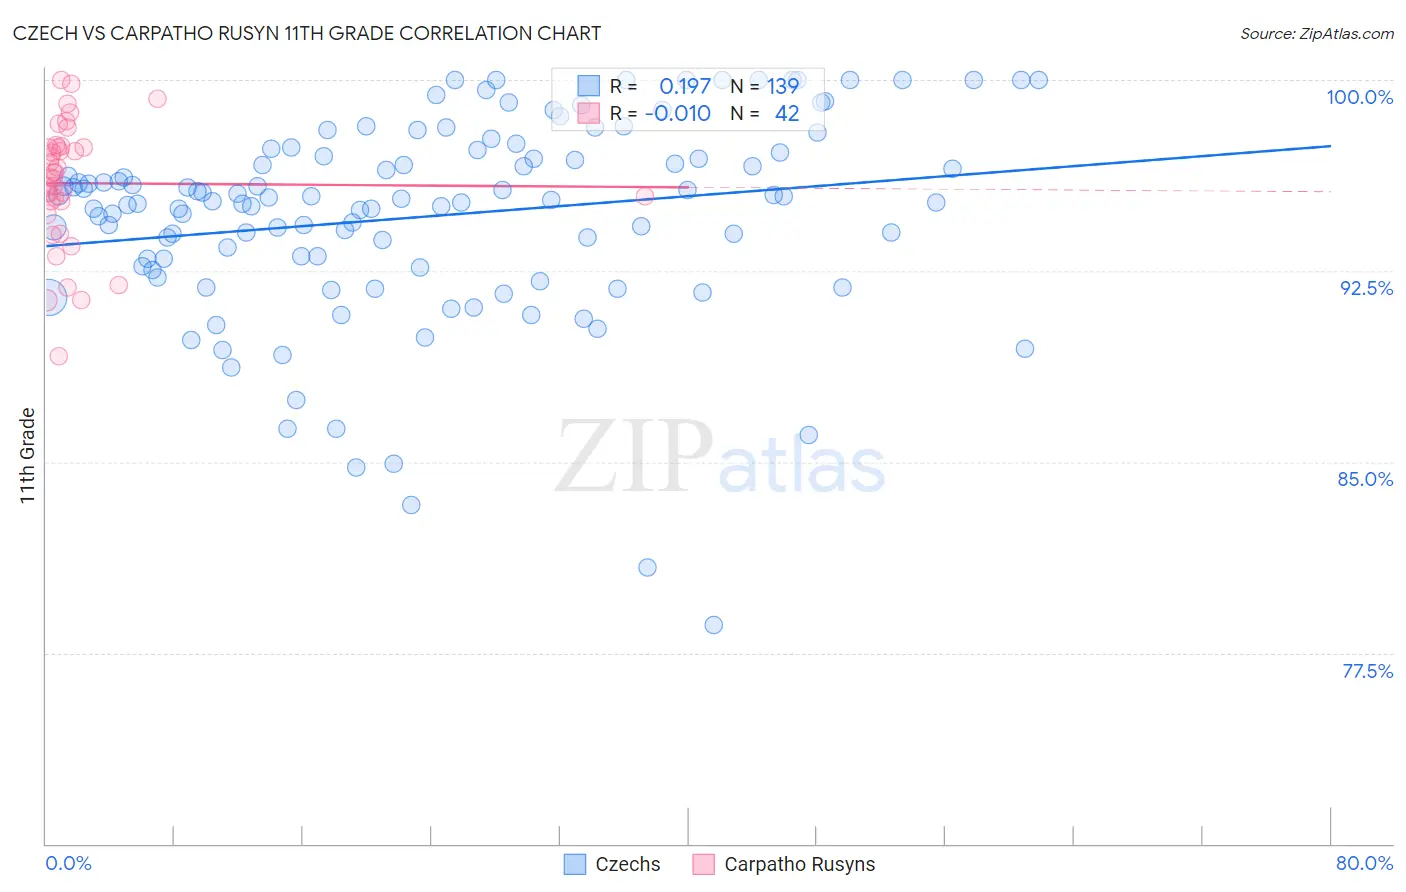
Czech vs Carpatho Rusyn 11th Grade Correlation Chart
The statistical analysis conducted on geographies consisting of 484,813,868 people shows a poor positive correlation between the proportion of Czechs and percentage of population with at least 11th grade education in the United States with a correlation coefficient (R) of 0.197 and weighted average of 94.4%. Similarly, the statistical analysis conducted on geographies consisting of 58,871,690 people shows no correlation between the proportion of Carpatho Rusyns and percentage of population with at least 11th grade education in the United States with a correlation coefficient (R) of -0.010 and weighted average of 94.8%, a difference of 0.45%.
11th Grade Correlation Summary
| Measurement | Czech | Carpatho Rusyn |
| Minimum | 78.6% | 89.1% |
| Maximum | 100.0% | 100.0% |
| Range | 21.4% | 10.9% |
| Mean | 94.7% | 95.9% |
| Median | 95.3% | 96.3% |
| Interquartile 25% (IQ1) | 92.7% | 95.2% |
| Interquartile 75% (IQ3) | 97.2% | 97.4% |
| Interquartile Range (IQR) | 4.5% | 2.1% |
| Standard Deviation (Sample) | 4.0% | 2.4% |
| Standard Deviation (Population) | 4.0% | 2.4% |
Demographics Similar to Czechs and Carpatho Rusyns by 11th Grade
In terms of 11th grade, the demographic groups most similar to Czechs are Tsimshian (94.4%, a difference of 0.0%), Tlingit-Haida (94.4%, a difference of 0.010%), Italian (94.5%, a difference of 0.030%), English (94.4%, a difference of 0.030%), and Luxembourger (94.5%, a difference of 0.060%). Similarly, the demographic groups most similar to Carpatho Rusyns are Lithuanian (94.8%, a difference of 0.050%), Slovak (94.9%, a difference of 0.060%), Polish (94.8%, a difference of 0.10%), Croatian (94.7%, a difference of 0.11%), and Danish (94.7%, a difference of 0.15%).
| Demographics | Rating | Rank | 11th Grade |
| Slovaks | 100.0 /100 | #4 | Exceptional 94.9% |
| Carpatho Rusyns | 100.0 /100 | #5 | Exceptional 94.8% |
| Lithuanians | 100.0 /100 | #6 | Exceptional 94.8% |
| Poles | 100.0 /100 | #7 | Exceptional 94.8% |
| Croatians | 100.0 /100 | #8 | Exceptional 94.7% |
| Danes | 100.0 /100 | #9 | Exceptional 94.7% |
| Finns | 100.0 /100 | #10 | Exceptional 94.7% |
| Germans | 100.0 /100 | #11 | Exceptional 94.7% |
| Latvians | 100.0 /100 | #12 | Exceptional 94.7% |
| Chinese | 100.0 /100 | #13 | Exceptional 94.6% |
| Eastern Europeans | 100.0 /100 | #14 | Exceptional 94.6% |
| Bulgarians | 100.0 /100 | #15 | Exceptional 94.5% |
| Immigrants | India | 100.0 /100 | #16 | Exceptional 94.5% |
| Luxembourgers | 100.0 /100 | #17 | Exceptional 94.5% |
| Maltese | 100.0 /100 | #18 | Exceptional 94.5% |
| Scandinavians | 100.0 /100 | #19 | Exceptional 94.5% |
| Italians | 100.0 /100 | #20 | Exceptional 94.5% |
| Tlingit-Haida | 100.0 /100 | #21 | Exceptional 94.4% |
| Tsimshian | 100.0 /100 | #22 | Exceptional 94.4% |
| Czechs | 100.0 /100 | #23 | Exceptional 94.4% |
| English | 100.0 /100 | #24 | Exceptional 94.4% |