Bhutanese vs Immigrants from Burma/Myanmar Master's Degree
COMPARE
Bhutanese
Immigrants from Burma/Myanmar
Master's Degree
Master's Degree Comparison
Bhutanese
Immigrants from Burma/Myanmar
17.2%
MASTER'S DEGREE
99.1/ 100
METRIC RATING
89th/ 347
METRIC RANK
13.5%
MASTER'S DEGREE
5.0/ 100
METRIC RATING
234th/ 347
METRIC RANK
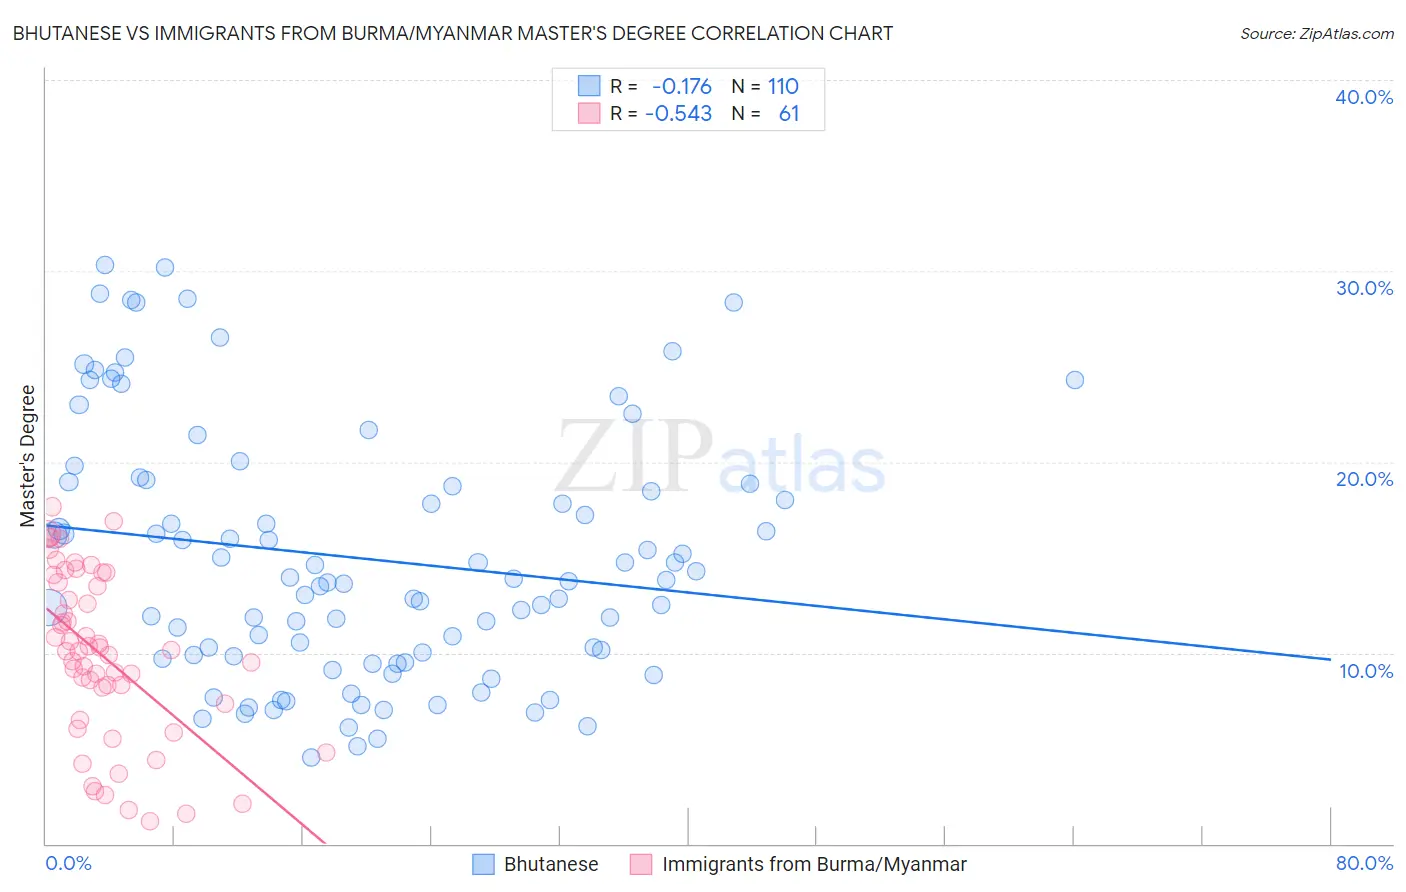
Bhutanese vs Immigrants from Burma/Myanmar Master's Degree Correlation Chart
The statistical analysis conducted on geographies consisting of 455,375,415 people shows a poor negative correlation between the proportion of Bhutanese and percentage of population with at least master's degree education in the United States with a correlation coefficient (R) of -0.176 and weighted average of 17.2%. Similarly, the statistical analysis conducted on geographies consisting of 172,302,674 people shows a substantial negative correlation between the proportion of Immigrants from Burma/Myanmar and percentage of population with at least master's degree education in the United States with a correlation coefficient (R) of -0.543 and weighted average of 13.5%, a difference of 27.2%.
Master's Degree Correlation Summary
| Measurement | Bhutanese | Immigrants from Burma/Myanmar |
| Minimum | 4.5% | 1.2% |
| Maximum | 30.3% | 17.6% |
| Range | 25.8% | 16.5% |
| Mean | 15.0% | 9.9% |
| Median | 13.8% | 10.1% |
| Interquartile 25% (IQ1) | 9.8% | 6.9% |
| Interquartile 75% (IQ3) | 18.9% | 13.9% |
| Interquartile Range (IQR) | 9.0% | 7.0% |
| Standard Deviation (Sample) | 6.6% | 4.4% |
| Standard Deviation (Population) | 6.6% | 4.3% |
Similar Demographics by Master's Degree
Demographics Similar to Bhutanese by Master's Degree
In terms of master's degree, the demographic groups most similar to Bhutanese are Immigrants from Egypt (17.2%, a difference of 0.020%), Immigrants from Canada (17.2%, a difference of 0.070%), Romanian (17.2%, a difference of 0.090%), Immigrants from North America (17.2%, a difference of 0.14%), and Immigrants from Italy (17.2%, a difference of 0.20%).
| Demographics | Rating | Rank | Master's Degree |
| Greeks | 99.5 /100 | #82 | Exceptional 17.5% |
| Immigrants | Zimbabwe | 99.5 /100 | #83 | Exceptional 17.4% |
| Immigrants | Scotland | 99.4 /100 | #84 | Exceptional 17.4% |
| Immigrants | Brazil | 99.4 /100 | #85 | Exceptional 17.4% |
| Immigrants | Croatia | 99.3 /100 | #86 | Exceptional 17.3% |
| Maltese | 99.3 /100 | #87 | Exceptional 17.3% |
| Immigrants | Canada | 99.2 /100 | #88 | Exceptional 17.2% |
| Bhutanese | 99.1 /100 | #89 | Exceptional 17.2% |
| Immigrants | Egypt | 99.1 /100 | #90 | Exceptional 17.2% |
| Romanians | 99.1 /100 | #91 | Exceptional 17.2% |
| Immigrants | North America | 99.1 /100 | #92 | Exceptional 17.2% |
| Immigrants | Italy | 99.1 /100 | #93 | Exceptional 17.2% |
| Ugandans | 99.0 /100 | #94 | Exceptional 17.1% |
| Immigrants | Morocco | 98.9 /100 | #95 | Exceptional 17.1% |
| Immigrants | Northern Africa | 98.9 /100 | #96 | Exceptional 17.1% |
Demographics Similar to Immigrants from Burma/Myanmar by Master's Degree
In terms of master's degree, the demographic groups most similar to Immigrants from Burma/Myanmar are German Russian (13.5%, a difference of 0.41%), Immigrants from Ecuador (13.6%, a difference of 0.50%), Immigrants from Guyana (13.4%, a difference of 0.52%), Immigrants from Philippines (13.6%, a difference of 0.65%), and Jamaican (13.4%, a difference of 0.75%).
| Demographics | Rating | Rank | Master's Degree |
| Immigrants | West Indies | 9.8 /100 | #227 | Tragic 13.9% |
| Whites/Caucasians | 9.1 /100 | #228 | Tragic 13.8% |
| British West Indians | 8.8 /100 | #229 | Tragic 13.8% |
| Dutch | 8.7 /100 | #230 | Tragic 13.8% |
| Guyanese | 7.6 /100 | #231 | Tragic 13.7% |
| Immigrants | Philippines | 6.0 /100 | #232 | Tragic 13.6% |
| Immigrants | Ecuador | 5.7 /100 | #233 | Tragic 13.6% |
| Immigrants | Burma/Myanmar | 5.0 /100 | #234 | Tragic 13.5% |
| German Russians | 4.5 /100 | #235 | Tragic 13.5% |
| Immigrants | Guyana | 4.4 /100 | #236 | Tragic 13.4% |
| Jamaicans | 4.1 /100 | #237 | Tragic 13.4% |
| Hmong | 4.0 /100 | #238 | Tragic 13.4% |
| Immigrants | Nonimmigrants | 3.4 /100 | #239 | Tragic 13.3% |
| Guamanians/Chamorros | 2.2 /100 | #240 | Tragic 13.1% |
| U.S. Virgin Islanders | 2.1 /100 | #241 | Tragic 13.1% |