Cypriot vs Macedonian Bachelor's Degree
COMPARE
Cypriot
Macedonian
Bachelor's Degree
Bachelor's Degree Comparison
Cypriots
Macedonians
49.0%
BACHELOR'S DEGREE
100.0/ 100
METRIC RATING
10th/ 347
METRIC RANK
41.4%
BACHELOR'S DEGREE
98.1/ 100
METRIC RATING
100th/ 347
METRIC RANK
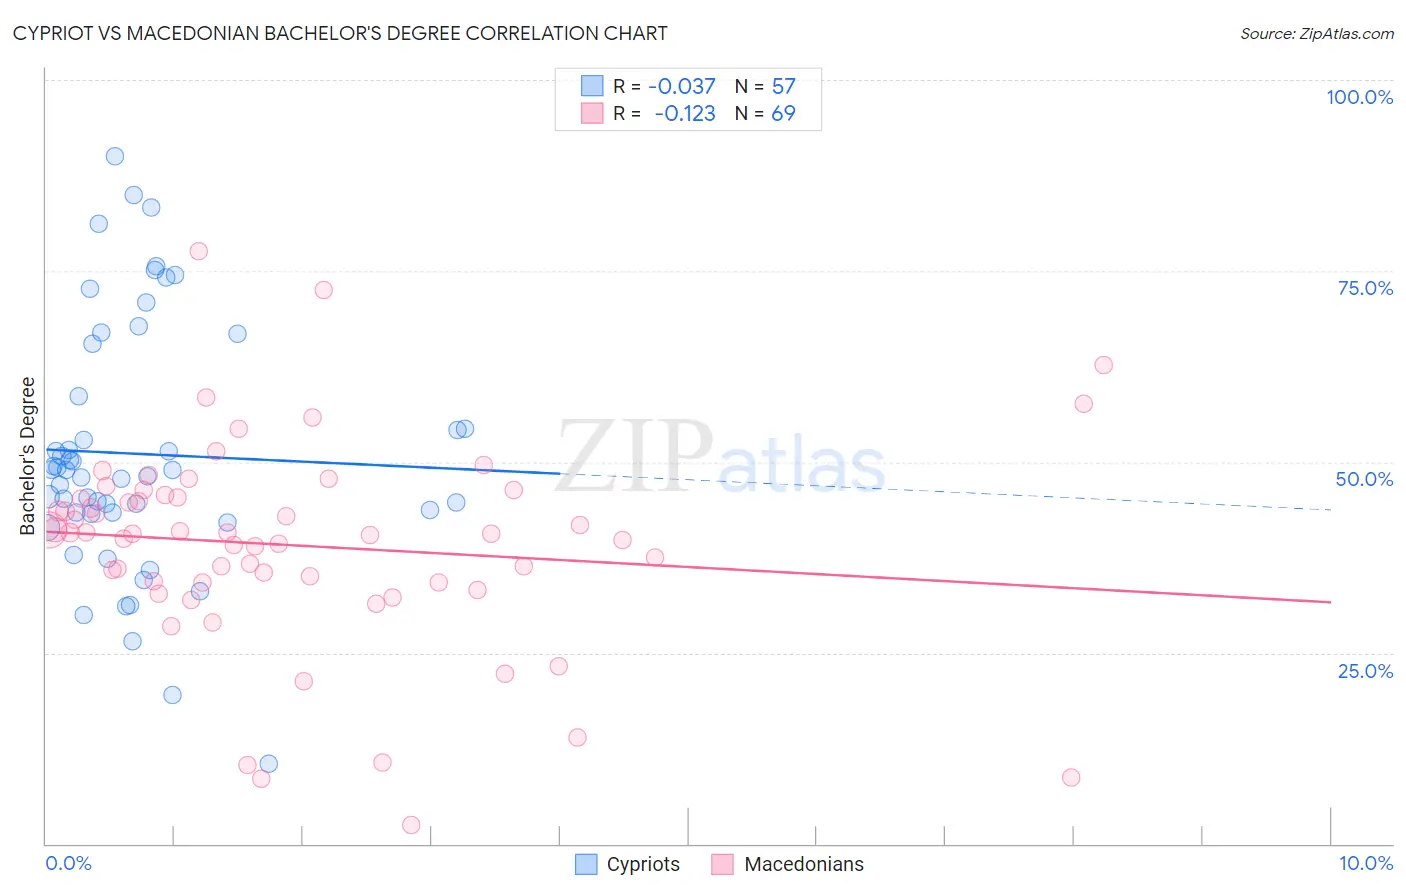
Cypriot vs Macedonian Bachelor's Degree Correlation Chart
The statistical analysis conducted on geographies consisting of 61,864,138 people shows no correlation between the proportion of Cypriots and percentage of population with at least bachelor's degree education in the United States with a correlation coefficient (R) of -0.037 and weighted average of 49.0%. Similarly, the statistical analysis conducted on geographies consisting of 132,656,802 people shows a poor negative correlation between the proportion of Macedonians and percentage of population with at least bachelor's degree education in the United States with a correlation coefficient (R) of -0.123 and weighted average of 41.4%, a difference of 18.4%.
Bachelor's Degree Correlation Summary
| Measurement | Cypriot | Macedonian |
| Minimum | 10.5% | 2.5% |
| Maximum | 90.0% | 77.6% |
| Range | 79.5% | 75.1% |
| Mean | 51.0% | 39.1% |
| Median | 48.9% | 40.7% |
| Interquartile 25% (IQ1) | 43.3% | 34.2% |
| Interquartile 75% (IQ3) | 62.0% | 45.5% |
| Interquartile Range (IQR) | 18.7% | 11.3% |
| Standard Deviation (Sample) | 16.5% | 13.5% |
| Standard Deviation (Population) | 16.3% | 13.4% |
Similar Demographics by Bachelor's Degree
Demographics Similar to Cypriots by Bachelor's Degree
In terms of bachelor's degree, the demographic groups most similar to Cypriots are Immigrants from Australia (48.5%, a difference of 1.1%), Immigrants from China (48.4%, a difference of 1.3%), Immigrants from South Central Asia (48.3%, a difference of 1.5%), Immigrants from Hong Kong (48.2%, a difference of 1.7%), and Immigrants from Eastern Asia (48.1%, a difference of 1.9%).
| Demographics | Rating | Rank | Bachelor's Degree |
| Immigrants | India | 100.0 /100 | #3 | Exceptional 51.3% |
| Immigrants | Taiwan | 100.0 /100 | #4 | Exceptional 51.2% |
| Iranians | 100.0 /100 | #5 | Exceptional 51.0% |
| Okinawans | 100.0 /100 | #6 | Exceptional 50.5% |
| Immigrants | Iran | 100.0 /100 | #7 | Exceptional 50.3% |
| Thais | 100.0 /100 | #8 | Exceptional 50.1% |
| Immigrants | Israel | 100.0 /100 | #9 | Exceptional 50.0% |
| Cypriots | 100.0 /100 | #10 | Exceptional 49.0% |
| Immigrants | Australia | 100.0 /100 | #11 | Exceptional 48.5% |
| Immigrants | China | 100.0 /100 | #12 | Exceptional 48.4% |
| Immigrants | South Central Asia | 100.0 /100 | #13 | Exceptional 48.3% |
| Immigrants | Hong Kong | 100.0 /100 | #14 | Exceptional 48.2% |
| Immigrants | Eastern Asia | 100.0 /100 | #15 | Exceptional 48.1% |
| Soviet Union | 100.0 /100 | #16 | Exceptional 47.9% |
| Eastern Europeans | 100.0 /100 | #17 | Exceptional 47.5% |
Demographics Similar to Macedonians by Bachelor's Degree
In terms of bachelor's degree, the demographic groups most similar to Macedonians are Immigrants from England (41.4%, a difference of 0.030%), Immigrants from Morocco (41.4%, a difference of 0.030%), Immigrants from Ukraine (41.5%, a difference of 0.26%), Immigrants from Italy (41.3%, a difference of 0.29%), and Romanian (41.6%, a difference of 0.37%).
| Demographics | Rating | Rank | Bachelor's Degree |
| Immigrants | Canada | 98.6 /100 | #93 | Exceptional 41.7% |
| Immigrants | Nepal | 98.6 /100 | #94 | Exceptional 41.7% |
| Immigrants | North America | 98.5 /100 | #95 | Exceptional 41.7% |
| Immigrants | Moldova | 98.4 /100 | #96 | Exceptional 41.6% |
| Romanians | 98.4 /100 | #97 | Exceptional 41.6% |
| Immigrants | Ukraine | 98.3 /100 | #98 | Exceptional 41.5% |
| Immigrants | England | 98.1 /100 | #99 | Exceptional 41.4% |
| Macedonians | 98.1 /100 | #100 | Exceptional 41.4% |
| Immigrants | Morocco | 98.0 /100 | #101 | Exceptional 41.4% |
| Immigrants | Italy | 97.8 /100 | #102 | Exceptional 41.3% |
| Chileans | 97.5 /100 | #103 | Exceptional 41.2% |
| Jordanians | 97.4 /100 | #104 | Exceptional 41.2% |
| Syrians | 97.4 /100 | #105 | Exceptional 41.1% |
| Alsatians | 97.0 /100 | #106 | Exceptional 41.0% |
| Northern Europeans | 96.8 /100 | #107 | Exceptional 41.0% |