Cypriot vs Immigrants from Israel 5th Grade
COMPARE
Cypriot
Immigrants from Israel
5th Grade
5th Grade Comparison
Cypriots
Immigrants from Israel
97.8%
5TH GRADE
98.9/ 100
METRIC RATING
86th/ 347
METRIC RANK
97.5%
5TH GRADE
79.1/ 100
METRIC RATING
148th/ 347
METRIC RANK
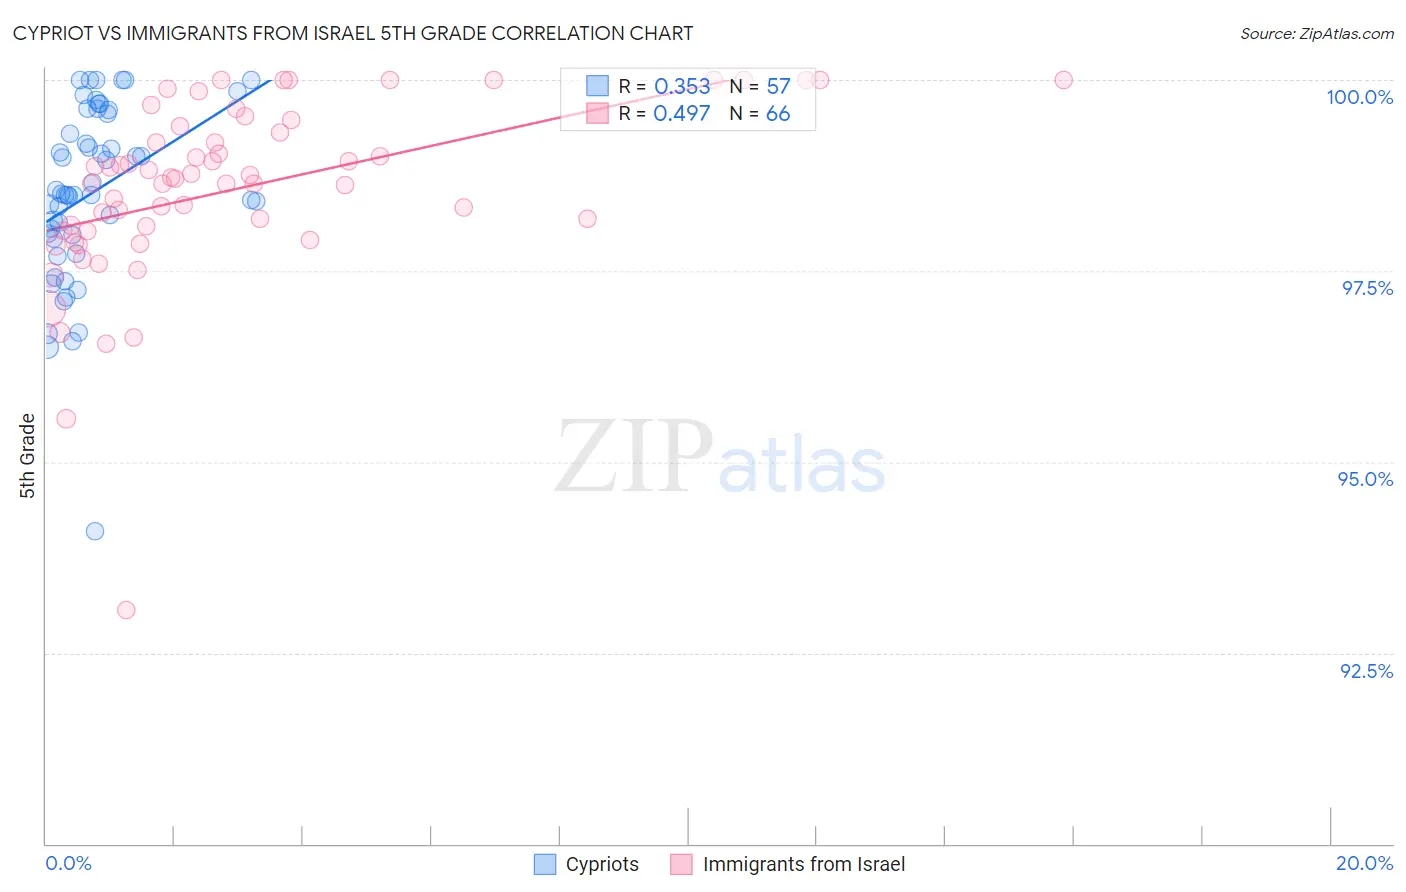
Cypriot vs Immigrants from Israel 5th Grade Correlation Chart
The statistical analysis conducted on geographies consisting of 61,870,289 people shows a mild positive correlation between the proportion of Cypriots and percentage of population with at least 5th grade education in the United States with a correlation coefficient (R) of 0.353 and weighted average of 97.8%. Similarly, the statistical analysis conducted on geographies consisting of 210,029,773 people shows a moderate positive correlation between the proportion of Immigrants from Israel and percentage of population with at least 5th grade education in the United States with a correlation coefficient (R) of 0.497 and weighted average of 97.5%, a difference of 0.33%.
5th Grade Correlation Summary
| Measurement | Cypriot | Immigrants from Israel |
| Minimum | 94.1% | 93.1% |
| Maximum | 100.0% | 100.0% |
| Range | 5.9% | 6.9% |
| Mean | 98.5% | 98.6% |
| Median | 98.5% | 98.7% |
| Interquartile 25% (IQ1) | 97.9% | 98.0% |
| Interquartile 75% (IQ3) | 99.6% | 99.4% |
| Interquartile Range (IQR) | 1.6% | 1.4% |
| Standard Deviation (Sample) | 1.2% | 1.2% |
| Standard Deviation (Population) | 1.1% | 1.2% |
Similar Demographics by 5th Grade
Demographics Similar to Cypriots by 5th Grade
In terms of 5th grade, the demographic groups most similar to Cypriots are Zimbabwean (97.8%, a difference of 0.010%), Potawatomi (97.8%, a difference of 0.010%), Immigrants from Belgium (97.8%, a difference of 0.010%), Immigrants from Australia (97.8%, a difference of 0.010%), and Shoshone (97.8%, a difference of 0.010%).
| Demographics | Rating | Rank | 5th Grade |
| Immigrants | Lithuania | 99.2 /100 | #79 | Exceptional 97.8% |
| Immigrants | India | 99.2 /100 | #80 | Exceptional 97.8% |
| Icelanders | 99.2 /100 | #81 | Exceptional 97.8% |
| Pueblo | 99.2 /100 | #82 | Exceptional 97.8% |
| Zimbabweans | 99.0 /100 | #83 | Exceptional 97.8% |
| Potawatomi | 99.0 /100 | #84 | Exceptional 97.8% |
| Immigrants | Belgium | 99.0 /100 | #85 | Exceptional 97.8% |
| Cypriots | 98.9 /100 | #86 | Exceptional 97.8% |
| Immigrants | Australia | 98.8 /100 | #87 | Exceptional 97.8% |
| Shoshone | 98.8 /100 | #88 | Exceptional 97.8% |
| Immigrants | South Africa | 98.8 /100 | #89 | Exceptional 97.8% |
| Immigrants | Ireland | 98.8 /100 | #90 | Exceptional 97.8% |
| Immigrants | Western Europe | 98.8 /100 | #91 | Exceptional 97.8% |
| Immigrants | Sweden | 98.7 /100 | #92 | Exceptional 97.8% |
| Delaware | 98.6 /100 | #93 | Exceptional 97.8% |
Demographics Similar to Immigrants from Israel by 5th Grade
In terms of 5th grade, the demographic groups most similar to Immigrants from Israel are Hopi (97.5%, a difference of 0.0%), Immigrants from South Central Asia (97.5%, a difference of 0.0%), Soviet Union (97.5%, a difference of 0.010%), Jordanian (97.5%, a difference of 0.020%), and Spaniard (97.5%, a difference of 0.020%).
| Demographics | Rating | Rank | 5th Grade |
| Seminole | 85.8 /100 | #141 | Excellent 97.5% |
| Israelis | 85.5 /100 | #142 | Excellent 97.5% |
| Immigrants | North Macedonia | 85.4 /100 | #143 | Excellent 97.5% |
| Immigrants | Greece | 83.2 /100 | #144 | Excellent 97.5% |
| Jordanians | 82.6 /100 | #145 | Excellent 97.5% |
| Spaniards | 81.9 /100 | #146 | Excellent 97.5% |
| Soviet Union | 81.2 /100 | #147 | Excellent 97.5% |
| Immigrants | Israel | 79.1 /100 | #148 | Good 97.5% |
| Hopi | 78.6 /100 | #149 | Good 97.5% |
| Immigrants | South Central Asia | 78.6 /100 | #150 | Good 97.5% |
| Immigrants | Eastern Europe | 75.0 /100 | #151 | Good 97.4% |
| Ute | 74.9 /100 | #152 | Good 97.4% |
| Alsatians | 74.3 /100 | #153 | Good 97.4% |
| Immigrants | Russia | 71.2 /100 | #154 | Good 97.4% |
| Immigrants | Bosnia and Herzegovina | 71.0 /100 | #155 | Good 97.4% |