Cuban vs French American Indian College, Under 1 year
COMPARE
Cuban
French American Indian
College, Under 1 year
College, Under 1 year Comparison
Cubans
French American Indians
58.6%
COLLEGE, UNDER 1 YEAR
0.0/ 100
METRIC RATING
299th/ 347
METRIC RANK
62.4%
COLLEGE, UNDER 1 YEAR
1.5/ 100
METRIC RATING
238th/ 347
METRIC RANK
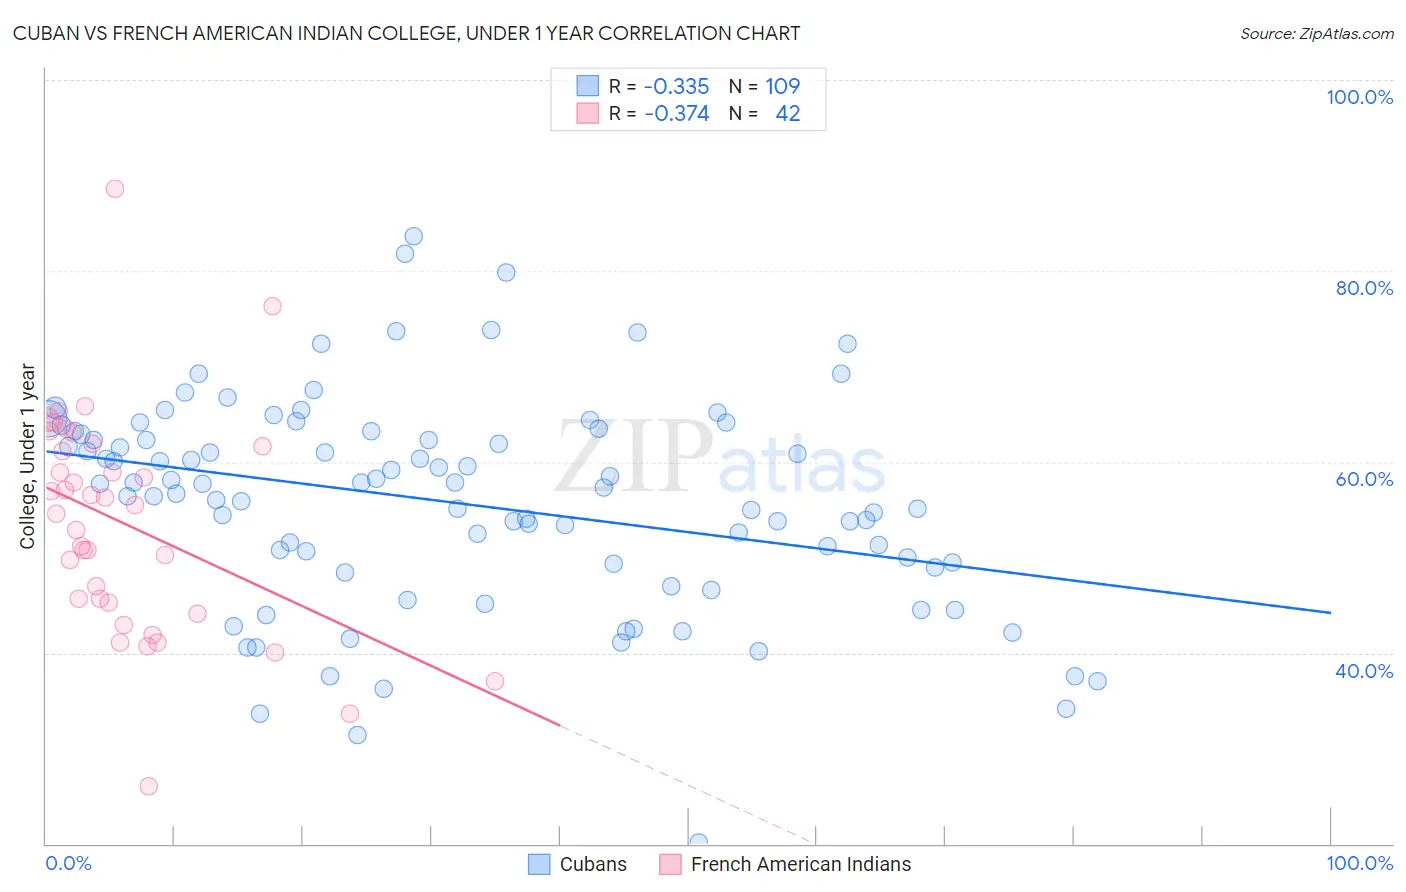
Cuban vs French American Indian College, Under 1 year Correlation Chart
The statistical analysis conducted on geographies consisting of 449,373,028 people shows a mild negative correlation between the proportion of Cubans and percentage of population with at least college, under 1 year education in the United States with a correlation coefficient (R) of -0.335 and weighted average of 58.6%. Similarly, the statistical analysis conducted on geographies consisting of 131,976,089 people shows a mild negative correlation between the proportion of French American Indians and percentage of population with at least college, under 1 year education in the United States with a correlation coefficient (R) of -0.374 and weighted average of 62.4%, a difference of 6.4%.
College, Under 1 year Correlation Summary
| Measurement | Cuban | French American Indian |
| Minimum | 20.1% | 26.1% |
| Maximum | 83.6% | 88.6% |
| Range | 63.5% | 62.5% |
| Mean | 55.7% | 53.5% |
| Median | 57.3% | 55.0% |
| Interquartile 25% (IQ1) | 49.1% | 45.3% |
| Interquartile 75% (IQ3) | 63.0% | 61.6% |
| Interquartile Range (IQR) | 13.9% | 16.3% |
| Standard Deviation (Sample) | 11.1% | 11.7% |
| Standard Deviation (Population) | 11.1% | 11.5% |
Similar Demographics by College, Under 1 year
Demographics Similar to Cubans by College, Under 1 year
In terms of college, under 1 year, the demographic groups most similar to Cubans are Immigrants from Ecuador (58.7%, a difference of 0.13%), Immigrants from Guyana (58.5%, a difference of 0.26%), Guyanese (59.0%, a difference of 0.63%), Central American Indian (59.0%, a difference of 0.68%), and Immigrants from Grenada (59.1%, a difference of 0.72%).
| Demographics | Rating | Rank | College, Under 1 year |
| Nicaraguans | 0.0 /100 | #292 | Tragic 59.2% |
| Seminole | 0.0 /100 | #293 | Tragic 59.1% |
| Immigrants | Belize | 0.0 /100 | #294 | Tragic 59.1% |
| Immigrants | Grenada | 0.0 /100 | #295 | Tragic 59.1% |
| Central American Indians | 0.0 /100 | #296 | Tragic 59.0% |
| Guyanese | 0.0 /100 | #297 | Tragic 59.0% |
| Immigrants | Ecuador | 0.0 /100 | #298 | Tragic 58.7% |
| Cubans | 0.0 /100 | #299 | Tragic 58.6% |
| Immigrants | Guyana | 0.0 /100 | #300 | Tragic 58.5% |
| Mexican American Indians | 0.0 /100 | #301 | Tragic 58.1% |
| Apache | 0.0 /100 | #302 | Tragic 58.0% |
| Immigrants | Dominica | 0.0 /100 | #303 | Tragic 57.9% |
| Kiowa | 0.0 /100 | #304 | Tragic 57.8% |
| Haitians | 0.0 /100 | #305 | Tragic 57.8% |
| Immigrants | Portugal | 0.0 /100 | #306 | Tragic 57.7% |
Demographics Similar to French American Indians by College, Under 1 year
In terms of college, under 1 year, the demographic groups most similar to French American Indians are Immigrants from Burma/Myanmar (62.5%, a difference of 0.090%), Immigrants (62.5%, a difference of 0.12%), Spanish American (62.6%, a difference of 0.25%), Chippewa (62.6%, a difference of 0.30%), and Iroquois (62.6%, a difference of 0.33%).
| Demographics | Rating | Rank | College, Under 1 year |
| Immigrants | Western Africa | 2.4 /100 | #231 | Tragic 62.8% |
| Osage | 2.2 /100 | #232 | Tragic 62.7% |
| Iroquois | 2.0 /100 | #233 | Tragic 62.6% |
| Chippewa | 2.0 /100 | #234 | Tragic 62.6% |
| Spanish Americans | 1.9 /100 | #235 | Tragic 62.6% |
| Immigrants | Immigrants | 1.7 /100 | #236 | Tragic 62.5% |
| Immigrants | Burma/Myanmar | 1.6 /100 | #237 | Tragic 62.5% |
| French American Indians | 1.5 /100 | #238 | Tragic 62.4% |
| Nepalese | 1.1 /100 | #239 | Tragic 62.2% |
| Aleuts | 1.1 /100 | #240 | Tragic 62.2% |
| Ottawa | 1.1 /100 | #241 | Tragic 62.2% |
| Malaysians | 1.1 /100 | #242 | Tragic 62.2% |
| Hawaiians | 1.1 /100 | #243 | Tragic 62.1% |
| Colville | 1.0 /100 | #244 | Tragic 62.1% |
| Delaware | 0.9 /100 | #245 | Tragic 62.1% |