Cuban vs Spaniard 9th Grade
COMPARE
Cuban
Spaniard
9th Grade
9th Grade Comparison
Cubans
Spaniards
93.2%
9TH GRADE
0.0/ 100
METRIC RATING
294th/ 347
METRIC RANK
94.9%
9TH GRADE
59.6/ 100
METRIC RATING
169th/ 347
METRIC RANK
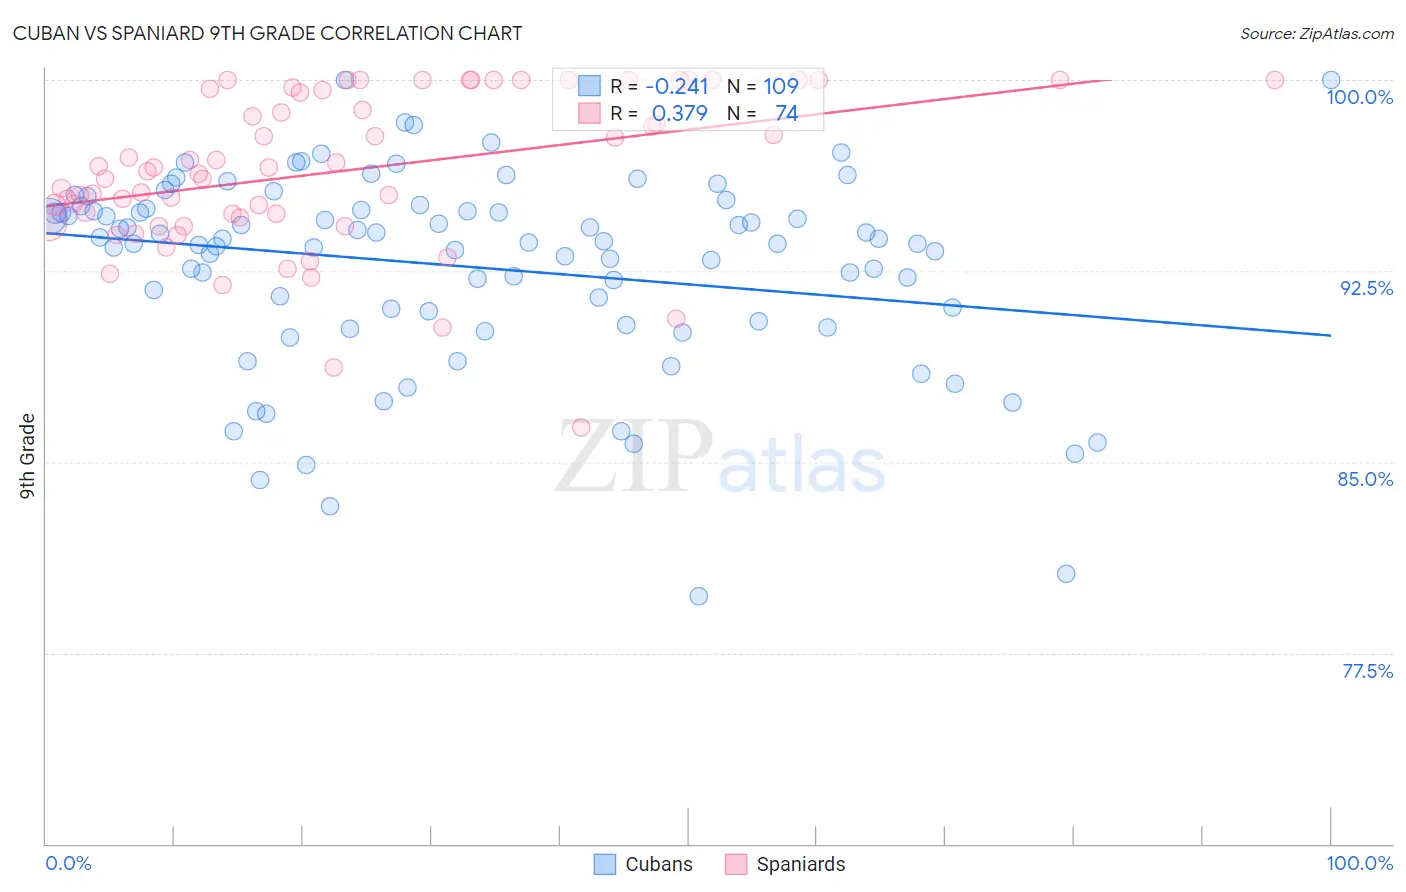
Cuban vs Spaniard 9th Grade Correlation Chart
The statistical analysis conducted on geographies consisting of 449,368,946 people shows a weak negative correlation between the proportion of Cubans and percentage of population with at least 9th grade education in the United States with a correlation coefficient (R) of -0.241 and weighted average of 93.2%. Similarly, the statistical analysis conducted on geographies consisting of 443,543,963 people shows a mild positive correlation between the proportion of Spaniards and percentage of population with at least 9th grade education in the United States with a correlation coefficient (R) of 0.379 and weighted average of 94.9%, a difference of 1.9%.
9th Grade Correlation Summary
| Measurement | Cuban | Spaniard |
| Minimum | 79.7% | 86.4% |
| Maximum | 100.0% | 100.0% |
| Range | 20.3% | 13.6% |
| Mean | 92.7% | 96.4% |
| Median | 93.6% | 96.5% |
| Interquartile 25% (IQ1) | 90.7% | 94.6% |
| Interquartile 75% (IQ3) | 94.9% | 99.6% |
| Interquartile Range (IQR) | 4.2% | 5.0% |
| Standard Deviation (Sample) | 3.8% | 3.1% |
| Standard Deviation (Population) | 3.8% | 3.0% |
Similar Demographics by 9th Grade
Demographics Similar to Cubans by 9th Grade
In terms of 9th grade, the demographic groups most similar to Cubans are Sri Lankan (93.2%, a difference of 0.0%), Immigrants from Laos (93.2%, a difference of 0.020%), Immigrants from Burma/Myanmar (93.1%, a difference of 0.020%), Indonesian (93.1%, a difference of 0.020%), and British West Indian (93.2%, a difference of 0.030%).
| Demographics | Rating | Rank | 9th Grade |
| Immigrants | St. Vincent and the Grenadines | 0.0 /100 | #287 | Tragic 93.4% |
| Immigrants | South Eastern Asia | 0.0 /100 | #288 | Tragic 93.3% |
| Immigrants | West Indies | 0.0 /100 | #289 | Tragic 93.3% |
| Pennsylvania Germans | 0.0 /100 | #290 | Tragic 93.3% |
| British West Indians | 0.0 /100 | #291 | Tragic 93.2% |
| Immigrants | Laos | 0.0 /100 | #292 | Tragic 93.2% |
| Sri Lankans | 0.0 /100 | #293 | Tragic 93.2% |
| Cubans | 0.0 /100 | #294 | Tragic 93.2% |
| Immigrants | Burma/Myanmar | 0.0 /100 | #295 | Tragic 93.1% |
| Indonesians | 0.0 /100 | #296 | Tragic 93.1% |
| Fijians | 0.0 /100 | #297 | Tragic 93.1% |
| Haitians | 0.0 /100 | #298 | Tragic 93.1% |
| Immigrants | Grenada | 0.0 /100 | #299 | Tragic 93.0% |
| Yaqui | 0.0 /100 | #300 | Tragic 92.9% |
| Immigrants | Haiti | 0.0 /100 | #301 | Tragic 92.7% |
Demographics Similar to Spaniards by 9th Grade
In terms of 9th grade, the demographic groups most similar to Spaniards are Immigrants from Brazil (95.0%, a difference of 0.010%), Chilean (95.0%, a difference of 0.010%), Alsatian (94.9%, a difference of 0.010%), Colville (94.9%, a difference of 0.010%), and Blackfeet (95.0%, a difference of 0.020%).
| Demographics | Rating | Rank | 9th Grade |
| Bermudans | 65.8 /100 | #162 | Good 95.0% |
| Pakistanis | 64.1 /100 | #163 | Good 95.0% |
| Venezuelans | 63.6 /100 | #164 | Good 95.0% |
| Blackfeet | 62.6 /100 | #165 | Good 95.0% |
| Ute | 62.6 /100 | #166 | Good 95.0% |
| Immigrants | Brazil | 61.1 /100 | #167 | Good 95.0% |
| Chileans | 60.7 /100 | #168 | Good 95.0% |
| Spaniards | 59.6 /100 | #169 | Average 94.9% |
| Alsatians | 58.6 /100 | #170 | Average 94.9% |
| Colville | 58.5 /100 | #171 | Average 94.9% |
| Iraqis | 54.0 /100 | #172 | Average 94.9% |
| Cheyenne | 51.5 /100 | #173 | Average 94.9% |
| Immigrants | Egypt | 50.0 /100 | #174 | Average 94.9% |
| Brazilians | 49.8 /100 | #175 | Average 94.9% |
| Immigrants | Spain | 49.1 /100 | #176 | Average 94.9% |