Cuban vs Immigrants from Uruguay 9th Grade
COMPARE
Cuban
Immigrants from Uruguay
9th Grade
9th Grade Comparison
Cubans
Immigrants from Uruguay
93.2%
9TH GRADE
0.0/ 100
METRIC RATING
294th/ 347
METRIC RANK
93.8%
9TH GRADE
0.2/ 100
METRIC RATING
269th/ 347
METRIC RANK
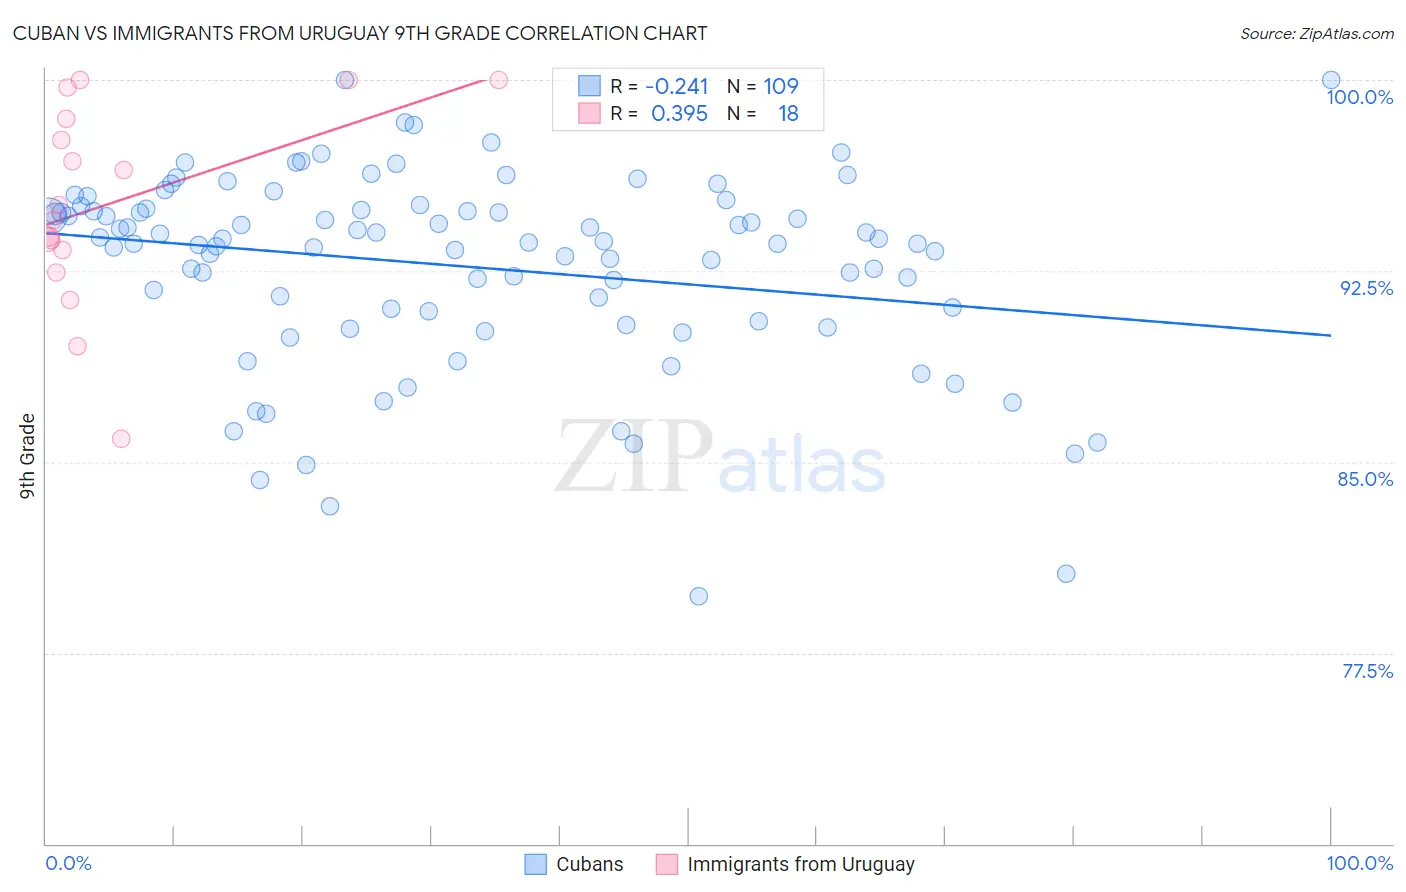
Cuban vs Immigrants from Uruguay 9th Grade Correlation Chart
The statistical analysis conducted on geographies consisting of 449,368,946 people shows a weak negative correlation between the proportion of Cubans and percentage of population with at least 9th grade education in the United States with a correlation coefficient (R) of -0.241 and weighted average of 93.2%. Similarly, the statistical analysis conducted on geographies consisting of 133,259,667 people shows a mild positive correlation between the proportion of Immigrants from Uruguay and percentage of population with at least 9th grade education in the United States with a correlation coefficient (R) of 0.395 and weighted average of 93.8%, a difference of 0.70%.
9th Grade Correlation Summary
| Measurement | Cuban | Immigrants from Uruguay |
| Minimum | 79.7% | 85.9% |
| Maximum | 100.0% | 100.0% |
| Range | 20.3% | 14.1% |
| Mean | 92.7% | 95.1% |
| Median | 93.6% | 94.8% |
| Interquartile 25% (IQ1) | 90.7% | 93.3% |
| Interquartile 75% (IQ3) | 94.9% | 98.5% |
| Interquartile Range (IQR) | 4.2% | 5.2% |
| Standard Deviation (Sample) | 3.8% | 3.9% |
| Standard Deviation (Population) | 3.8% | 3.8% |
Similar Demographics by 9th Grade
Demographics Similar to Cubans by 9th Grade
In terms of 9th grade, the demographic groups most similar to Cubans are Sri Lankan (93.2%, a difference of 0.0%), Immigrants from Laos (93.2%, a difference of 0.020%), Immigrants from Burma/Myanmar (93.1%, a difference of 0.020%), Indonesian (93.1%, a difference of 0.020%), and British West Indian (93.2%, a difference of 0.030%).
| Demographics | Rating | Rank | 9th Grade |
| Immigrants | St. Vincent and the Grenadines | 0.0 /100 | #287 | Tragic 93.4% |
| Immigrants | South Eastern Asia | 0.0 /100 | #288 | Tragic 93.3% |
| Immigrants | West Indies | 0.0 /100 | #289 | Tragic 93.3% |
| Pennsylvania Germans | 0.0 /100 | #290 | Tragic 93.3% |
| British West Indians | 0.0 /100 | #291 | Tragic 93.2% |
| Immigrants | Laos | 0.0 /100 | #292 | Tragic 93.2% |
| Sri Lankans | 0.0 /100 | #293 | Tragic 93.2% |
| Cubans | 0.0 /100 | #294 | Tragic 93.2% |
| Immigrants | Burma/Myanmar | 0.0 /100 | #295 | Tragic 93.1% |
| Indonesians | 0.0 /100 | #296 | Tragic 93.1% |
| Fijians | 0.0 /100 | #297 | Tragic 93.1% |
| Haitians | 0.0 /100 | #298 | Tragic 93.1% |
| Immigrants | Grenada | 0.0 /100 | #299 | Tragic 93.0% |
| Yaqui | 0.0 /100 | #300 | Tragic 92.9% |
| Immigrants | Haiti | 0.0 /100 | #301 | Tragic 92.7% |
Demographics Similar to Immigrants from Uruguay by 9th Grade
In terms of 9th grade, the demographic groups most similar to Immigrants from Uruguay are Yuman (93.8%, a difference of 0.010%), Immigrants from Ghana (93.8%, a difference of 0.030%), Immigrants from Bolivia (93.9%, a difference of 0.040%), Immigrants from Western Africa (93.8%, a difference of 0.040%), and Immigrants from South America (93.8%, a difference of 0.050%).
| Demographics | Rating | Rank | 9th Grade |
| Immigrants | Jamaica | 0.4 /100 | #262 | Tragic 93.9% |
| Immigrants | Uzbekistan | 0.4 /100 | #263 | Tragic 93.9% |
| Immigrants | Congo | 0.4 /100 | #264 | Tragic 93.9% |
| Natives/Alaskans | 0.4 /100 | #265 | Tragic 93.9% |
| Navajo | 0.3 /100 | #266 | Tragic 93.9% |
| Armenians | 0.3 /100 | #267 | Tragic 93.9% |
| Immigrants | Bolivia | 0.3 /100 | #268 | Tragic 93.9% |
| Immigrants | Uruguay | 0.2 /100 | #269 | Tragic 93.8% |
| Yuman | 0.2 /100 | #270 | Tragic 93.8% |
| Immigrants | Ghana | 0.2 /100 | #271 | Tragic 93.8% |
| Immigrants | Western Africa | 0.2 /100 | #272 | Tragic 93.8% |
| Immigrants | South America | 0.2 /100 | #273 | Tragic 93.8% |
| Peruvians | 0.2 /100 | #274 | Tragic 93.8% |
| Immigrants | Colombia | 0.2 /100 | #275 | Tragic 93.8% |
| West Indians | 0.2 /100 | #276 | Tragic 93.7% |