Cuban vs Okinawan Per Capita Income
COMPARE
Cuban
Okinawan
Per Capita Income
Per Capita Income Comparison
Cubans
Okinawans
$37,383
PER CAPITA INCOME
0.1/ 100
METRIC RATING
294th/ 347
METRIC RANK
$55,817
PER CAPITA INCOME
100.0/ 100
METRIC RATING
10th/ 347
METRIC RANK
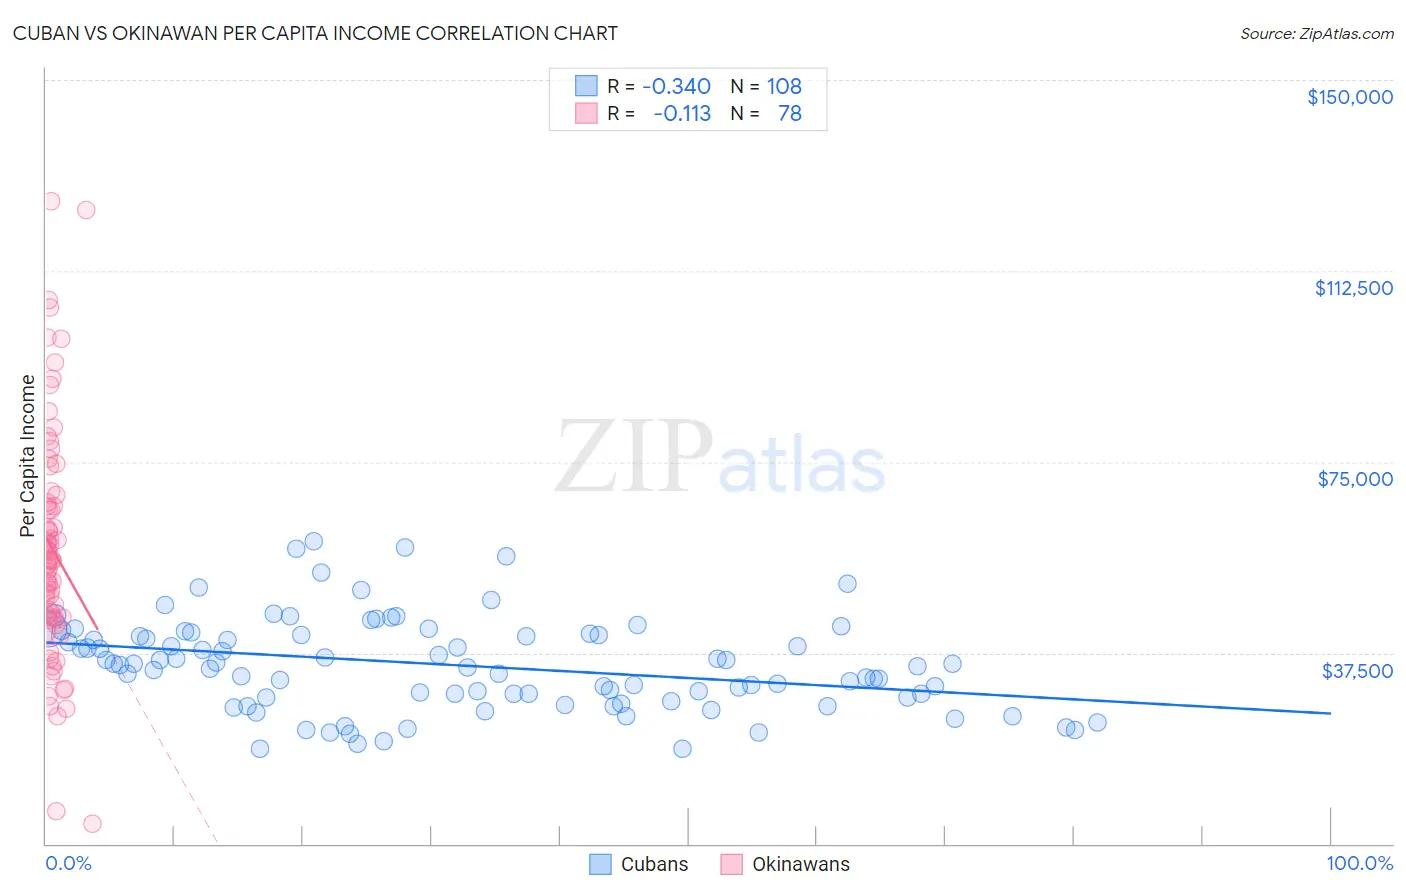
Cuban vs Okinawan Per Capita Income Correlation Chart
The statistical analysis conducted on geographies consisting of 449,330,794 people shows a mild negative correlation between the proportion of Cubans and per capita income in the United States with a correlation coefficient (R) of -0.340 and weighted average of $37,383. Similarly, the statistical analysis conducted on geographies consisting of 73,745,153 people shows a poor negative correlation between the proportion of Okinawans and per capita income in the United States with a correlation coefficient (R) of -0.113 and weighted average of $55,817, a difference of 49.3%.
Per Capita Income Correlation Summary
| Measurement | Cuban | Okinawan |
| Minimum | $18,566 | $4,017 |
| Maximum | $59,513 | $126,204 |
| Range | $40,947 | $122,187 |
| Mean | $35,073 | $57,948 |
| Median | $35,004 | $55,509 |
| Interquartile 25% (IQ1) | $28,628 | $44,396 |
| Interquartile 75% (IQ3) | $40,960 | $66,910 |
| Interquartile Range (IQR) | $12,332 | $22,513 |
| Standard Deviation (Sample) | $9,056 | $23,213 |
| Standard Deviation (Population) | $9,014 | $23,064 |
Similar Demographics by Per Capita Income
Demographics Similar to Cubans by Per Capita Income
In terms of per capita income, the demographic groups most similar to Cubans are Mexican American Indian ($37,407, a difference of 0.070%), Immigrants from Dominican Republic ($37,306, a difference of 0.21%), Immigrants from Micronesia ($37,464, a difference of 0.22%), Indonesian ($37,300, a difference of 0.22%), and Haitian ($37,289, a difference of 0.25%).
| Demographics | Rating | Rank | Per Capita Income |
| Dominicans | 0.1 /100 | #287 | Tragic $37,697 |
| Blackfeet | 0.1 /100 | #288 | Tragic $37,695 |
| U.S. Virgin Islanders | 0.1 /100 | #289 | Tragic $37,589 |
| Immigrants | Guatemala | 0.1 /100 | #290 | Tragic $37,550 |
| Cajuns | 0.1 /100 | #291 | Tragic $37,527 |
| Immigrants | Micronesia | 0.1 /100 | #292 | Tragic $37,464 |
| Mexican American Indians | 0.1 /100 | #293 | Tragic $37,407 |
| Cubans | 0.1 /100 | #294 | Tragic $37,383 |
| Immigrants | Dominican Republic | 0.1 /100 | #295 | Tragic $37,306 |
| Indonesians | 0.1 /100 | #296 | Tragic $37,300 |
| Haitians | 0.1 /100 | #297 | Tragic $37,289 |
| Immigrants | Caribbean | 0.1 /100 | #298 | Tragic $37,254 |
| Cherokee | 0.1 /100 | #299 | Tragic $37,203 |
| Immigrants | Bahamas | 0.1 /100 | #300 | Tragic $37,193 |
| Ottawa | 0.1 /100 | #301 | Tragic $37,101 |
Demographics Similar to Okinawans by Per Capita Income
In terms of per capita income, the demographic groups most similar to Okinawans are Eastern European ($55,780, a difference of 0.070%), Immigrants from Sweden ($55,582, a difference of 0.42%), Immigrants from India ($55,268, a difference of 0.99%), Immigrants from Belgium ($55,082, a difference of 1.3%), and Immigrants from Ireland ($56,584, a difference of 1.4%).
| Demographics | Rating | Rank | Per Capita Income |
| Immigrants | Singapore | 100.0 /100 | #3 | Exceptional $58,353 |
| Immigrants | Australia | 100.0 /100 | #4 | Exceptional $57,953 |
| Immigrants | Iran | 100.0 /100 | #5 | Exceptional $57,759 |
| Immigrants | Taiwan | 100.0 /100 | #6 | Exceptional $57,742 |
| Immigrants | Israel | 100.0 /100 | #7 | Exceptional $57,384 |
| Immigrants | Hong Kong | 100.0 /100 | #8 | Exceptional $56,709 |
| Immigrants | Ireland | 100.0 /100 | #9 | Exceptional $56,584 |
| Okinawans | 100.0 /100 | #10 | Exceptional $55,817 |
| Eastern Europeans | 100.0 /100 | #11 | Exceptional $55,780 |
| Immigrants | Sweden | 100.0 /100 | #12 | Exceptional $55,582 |
| Immigrants | India | 100.0 /100 | #13 | Exceptional $55,268 |
| Immigrants | Belgium | 100.0 /100 | #14 | Exceptional $55,082 |
| Cypriots | 100.0 /100 | #15 | Exceptional $54,899 |
| Immigrants | Switzerland | 100.0 /100 | #16 | Exceptional $54,866 |
| Immigrants | France | 100.0 /100 | #17 | Exceptional $54,557 |