Immigrants from Cabo Verde vs Lumbee No Schooling Completed
COMPARE
Immigrants from Cabo Verde
Lumbee
No Schooling Completed
No Schooling Completed Comparison
Immigrants from Cabo Verde
Lumbee
3.5%
NO SCHOOLING COMPLETED
0.0/ 100
METRIC RATING
337th/ 347
METRIC RANK
1.5%
NO SCHOOLING COMPLETED
100.0/ 100
METRIC RATING
29th/ 347
METRIC RANK
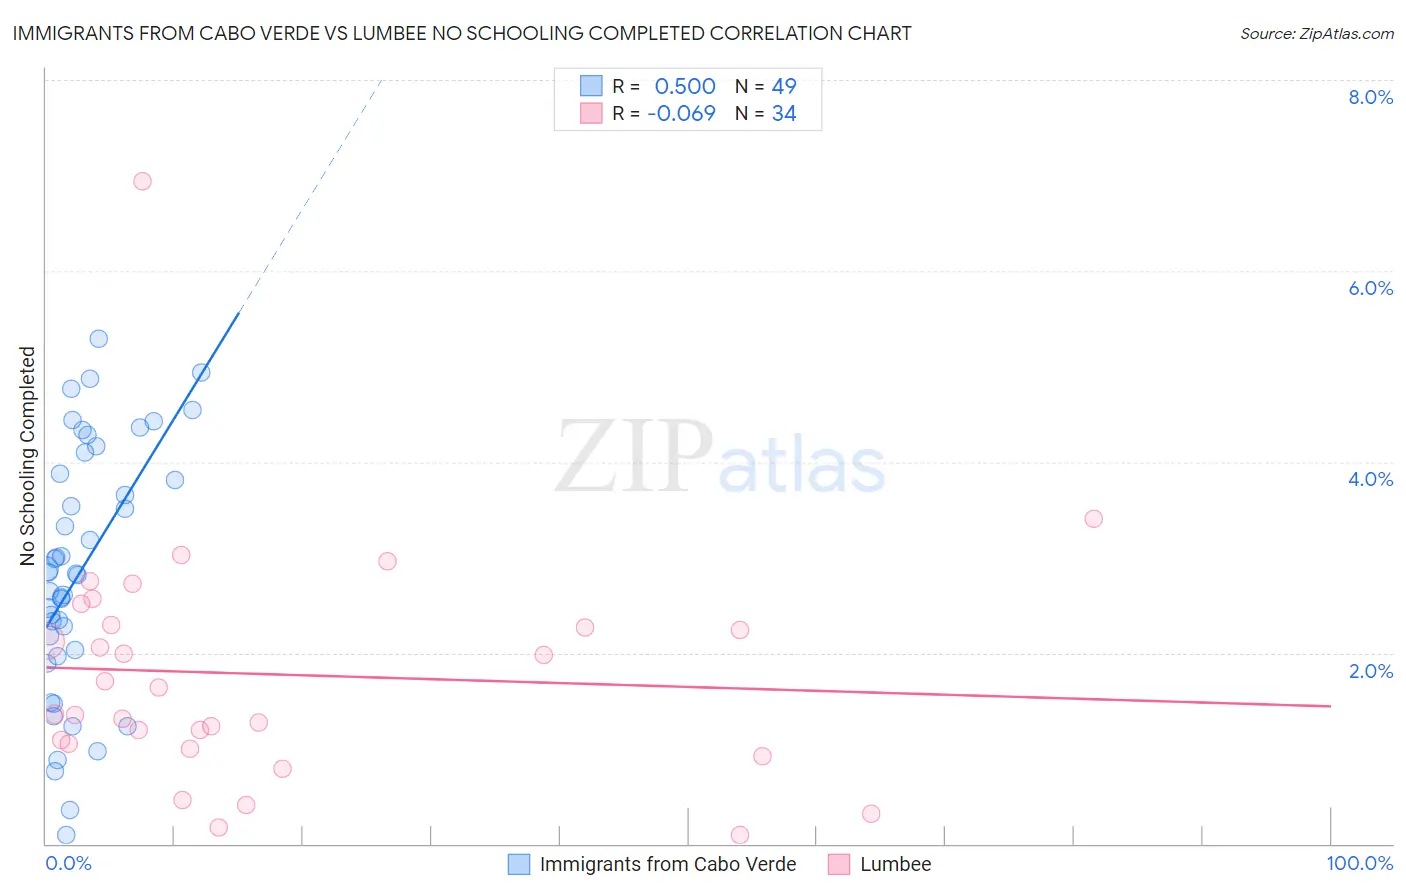
Immigrants from Cabo Verde vs Lumbee No Schooling Completed Correlation Chart
The statistical analysis conducted on geographies consisting of 38,057,736 people shows a substantial positive correlation between the proportion of Immigrants from Cabo Verde and percentage of population with no schooling in the United States with a correlation coefficient (R) of 0.500 and weighted average of 3.5%. Similarly, the statistical analysis conducted on geographies consisting of 91,955,229 people shows a slight negative correlation between the proportion of Lumbee and percentage of population with no schooling in the United States with a correlation coefficient (R) of -0.069 and weighted average of 1.5%, a difference of 133.4%.
No Schooling Completed Correlation Summary
| Measurement | Immigrants from Cabo Verde | Lumbee |
| Minimum | 0.088% | 0.093% |
| Maximum | 5.3% | 6.9% |
| Range | 5.2% | 6.9% |
| Mean | 2.9% | 1.8% |
| Median | 2.8% | 1.5% |
| Interquartile 25% (IQ1) | 2.0% | 1.0% |
| Interquartile 75% (IQ3) | 4.0% | 2.3% |
| Interquartile Range (IQR) | 2.0% | 1.2% |
| Standard Deviation (Sample) | 1.3% | 1.3% |
| Standard Deviation (Population) | 1.3% | 1.2% |
Similar Demographics by No Schooling Completed
Demographics Similar to Immigrants from Cabo Verde by No Schooling Completed
In terms of no schooling completed, the demographic groups most similar to Immigrants from Cabo Verde are Bangladeshi (3.5%, a difference of 0.23%), Yakama (3.6%, a difference of 0.55%), Immigrants from Fiji (3.5%, a difference of 0.71%), Immigrants from Cambodia (3.5%, a difference of 1.1%), and Immigrants from Guatemala (3.6%, a difference of 1.2%).
| Demographics | Rating | Rank | No Schooling Completed |
| Immigrants | Armenia | 0.0 /100 | #330 | Tragic 3.3% |
| Japanese | 0.0 /100 | #331 | Tragic 3.3% |
| Central Americans | 0.0 /100 | #332 | Tragic 3.4% |
| Immigrants | Dominican Republic | 0.0 /100 | #333 | Tragic 3.4% |
| Guatemalans | 0.0 /100 | #334 | Tragic 3.5% |
| Immigrants | Cambodia | 0.0 /100 | #335 | Tragic 3.5% |
| Immigrants | Fiji | 0.0 /100 | #336 | Tragic 3.5% |
| Immigrants | Cabo Verde | 0.0 /100 | #337 | Tragic 3.5% |
| Bangladeshis | 0.0 /100 | #338 | Tragic 3.5% |
| Yakama | 0.0 /100 | #339 | Tragic 3.6% |
| Immigrants | Guatemala | 0.0 /100 | #340 | Tragic 3.6% |
| Immigrants | Central America | 0.0 /100 | #341 | Tragic 3.6% |
| Immigrants | Mexico | 0.0 /100 | #342 | Tragic 3.6% |
| Salvadorans | 0.0 /100 | #343 | Tragic 3.7% |
| Nepalese | 0.0 /100 | #344 | Tragic 3.8% |
Demographics Similar to Lumbee by No Schooling Completed
In terms of no schooling completed, the demographic groups most similar to Lumbee are British (1.5%, a difference of 0.48%), Inupiat (1.5%, a difference of 0.51%), French Canadian (1.5%, a difference of 0.91%), Swiss (1.5%, a difference of 0.91%), and Scandinavian (1.5%, a difference of 0.92%).
| Demographics | Rating | Rank | No Schooling Completed |
| Alaska Natives | 100.0 /100 | #22 | Exceptional 1.5% |
| Europeans | 100.0 /100 | #23 | Exceptional 1.5% |
| Pennsylvania Germans | 100.0 /100 | #24 | Exceptional 1.5% |
| French | 100.0 /100 | #25 | Exceptional 1.5% |
| Czechs | 100.0 /100 | #26 | Exceptional 1.5% |
| Scandinavians | 100.0 /100 | #27 | Exceptional 1.5% |
| French Canadians | 100.0 /100 | #28 | Exceptional 1.5% |
| Lumbee | 100.0 /100 | #29 | Exceptional 1.5% |
| British | 100.0 /100 | #30 | Exceptional 1.5% |
| Inupiat | 100.0 /100 | #31 | Exceptional 1.5% |
| Swiss | 100.0 /100 | #32 | Exceptional 1.5% |
| Italians | 100.0 /100 | #33 | Exceptional 1.5% |
| Latvians | 100.0 /100 | #34 | Exceptional 1.5% |
| Eastern Europeans | 100.0 /100 | #35 | Exceptional 1.6% |
| Aleuts | 99.9 /100 | #36 | Exceptional 1.6% |