Cuban vs Bahamian 3rd Grade
COMPARE
Cuban
Bahamian
3rd Grade
3rd Grade Comparison
Cubans
Bahamians
97.3%
3RD GRADE
0.2/ 100
METRIC RATING
268th/ 347
METRIC RANK
97.5%
3RD GRADE
4.4/ 100
METRIC RATING
224th/ 347
METRIC RANK
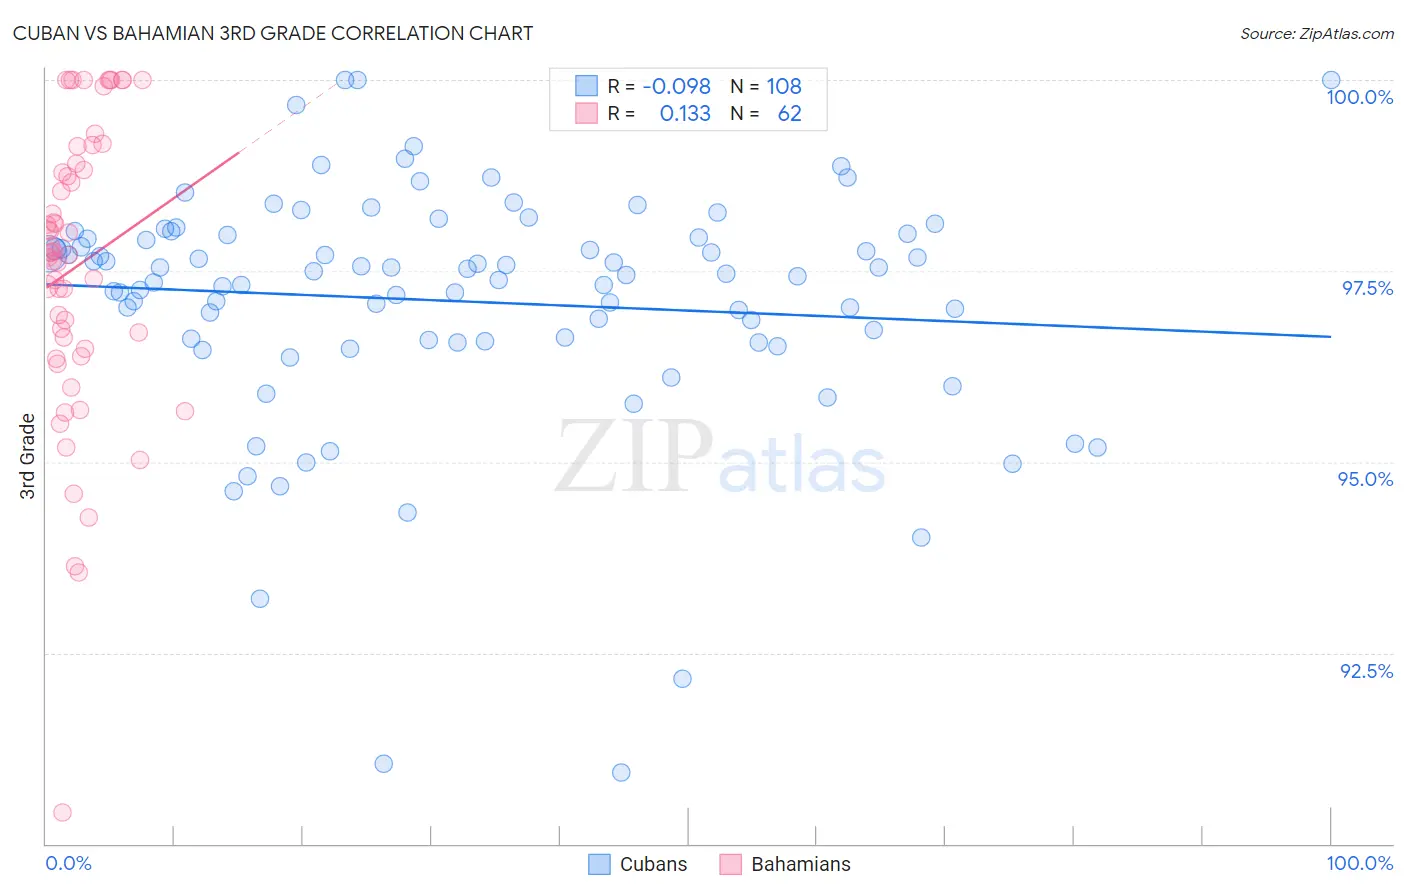
Cuban vs Bahamian 3rd Grade Correlation Chart
The statistical analysis conducted on geographies consisting of 449,326,865 people shows a slight negative correlation between the proportion of Cubans and percentage of population with at least 3rd grade education in the United States with a correlation coefficient (R) of -0.098 and weighted average of 97.3%. Similarly, the statistical analysis conducted on geographies consisting of 112,697,105 people shows a poor positive correlation between the proportion of Bahamians and percentage of population with at least 3rd grade education in the United States with a correlation coefficient (R) of 0.133 and weighted average of 97.5%, a difference of 0.25%.
3rd Grade Correlation Summary
| Measurement | Cuban | Bahamian |
| Minimum | 90.9% | 90.4% |
| Maximum | 100.0% | 100.0% |
| Range | 9.1% | 9.6% |
| Mean | 97.1% | 97.6% |
| Median | 97.5% | 97.7% |
| Interquartile 25% (IQ1) | 96.6% | 96.5% |
| Interquartile 75% (IQ3) | 98.0% | 98.9% |
| Interquartile Range (IQR) | 1.4% | 2.4% |
| Standard Deviation (Sample) | 1.6% | 1.9% |
| Standard Deviation (Population) | 1.6% | 1.9% |
Similar Demographics by 3rd Grade
Demographics Similar to Cubans by 3rd Grade
In terms of 3rd grade, the demographic groups most similar to Cubans are Fijian (97.3%, a difference of 0.0%), Yaqui (97.3%, a difference of 0.010%), Immigrants from Nigeria (97.3%, a difference of 0.010%), Immigrants from Jamaica (97.3%, a difference of 0.020%), and Taiwanese (97.3%, a difference of 0.030%).
| Demographics | Rating | Rank | 3rd Grade |
| Immigrants | South America | 0.4 /100 | #261 | Tragic 97.3% |
| Immigrants | Sierra Leone | 0.4 /100 | #262 | Tragic 97.3% |
| Taiwanese | 0.3 /100 | #263 | Tragic 97.3% |
| West Indians | 0.3 /100 | #264 | Tragic 97.3% |
| Immigrants | Jamaica | 0.3 /100 | #265 | Tragic 97.3% |
| Yaqui | 0.3 /100 | #266 | Tragic 97.3% |
| Immigrants | Nigeria | 0.3 /100 | #267 | Tragic 97.3% |
| Cubans | 0.2 /100 | #268 | Tragic 97.3% |
| Fijians | 0.2 /100 | #269 | Tragic 97.3% |
| Immigrants | China | 0.2 /100 | #270 | Tragic 97.2% |
| Puerto Ricans | 0.2 /100 | #271 | Tragic 97.2% |
| Ghanaians | 0.1 /100 | #272 | Tragic 97.2% |
| Immigrants | Peru | 0.1 /100 | #273 | Tragic 97.2% |
| Immigrants | Cameroon | 0.1 /100 | #274 | Tragic 97.2% |
| Immigrants | Uzbekistan | 0.1 /100 | #275 | Tragic 97.2% |
Demographics Similar to Bahamians by 3rd Grade
In terms of 3rd grade, the demographic groups most similar to Bahamians are Sierra Leonean (97.5%, a difference of 0.0%), Immigrants from Syria (97.5%, a difference of 0.0%), Tongan (97.5%, a difference of 0.0%), Immigrants from Morocco (97.5%, a difference of 0.010%), and Uruguayan (97.5%, a difference of 0.010%).
| Demographics | Rating | Rank | 3rd Grade |
| South American Indians | 5.7 /100 | #217 | Tragic 97.5% |
| Immigrants | Nepal | 5.3 /100 | #218 | Tragic 97.5% |
| Immigrants | Panama | 5.2 /100 | #219 | Tragic 97.5% |
| Immigrants | Morocco | 5.0 /100 | #220 | Tragic 97.5% |
| Uruguayans | 5.0 /100 | #221 | Tragic 97.5% |
| Sierra Leoneans | 4.6 /100 | #222 | Tragic 97.5% |
| Immigrants | Syria | 4.4 /100 | #223 | Tragic 97.5% |
| Bahamians | 4.4 /100 | #224 | Tragic 97.5% |
| Tongans | 4.3 /100 | #225 | Tragic 97.5% |
| Sudanese | 4.1 /100 | #226 | Tragic 97.5% |
| Immigrants | Sudan | 3.4 /100 | #227 | Tragic 97.5% |
| Sub-Saharan Africans | 3.2 /100 | #228 | Tragic 97.5% |
| Senegalese | 3.0 /100 | #229 | Tragic 97.5% |
| Immigrants | Pakistan | 2.7 /100 | #230 | Tragic 97.5% |
| Immigrants | Costa Rica | 2.7 /100 | #231 | Tragic 97.5% |