Immigrants from Cambodia vs Kenyan 3rd Grade
COMPARE
Immigrants from Cambodia
Kenyan
3rd Grade
3rd Grade Comparison
Immigrants from Cambodia
Kenyans
96.2%
3RD GRADE
0.0/ 100
METRIC RATING
334th/ 347
METRIC RANK
97.8%
3RD GRADE
51.8/ 100
METRIC RATING
171st/ 347
METRIC RANK
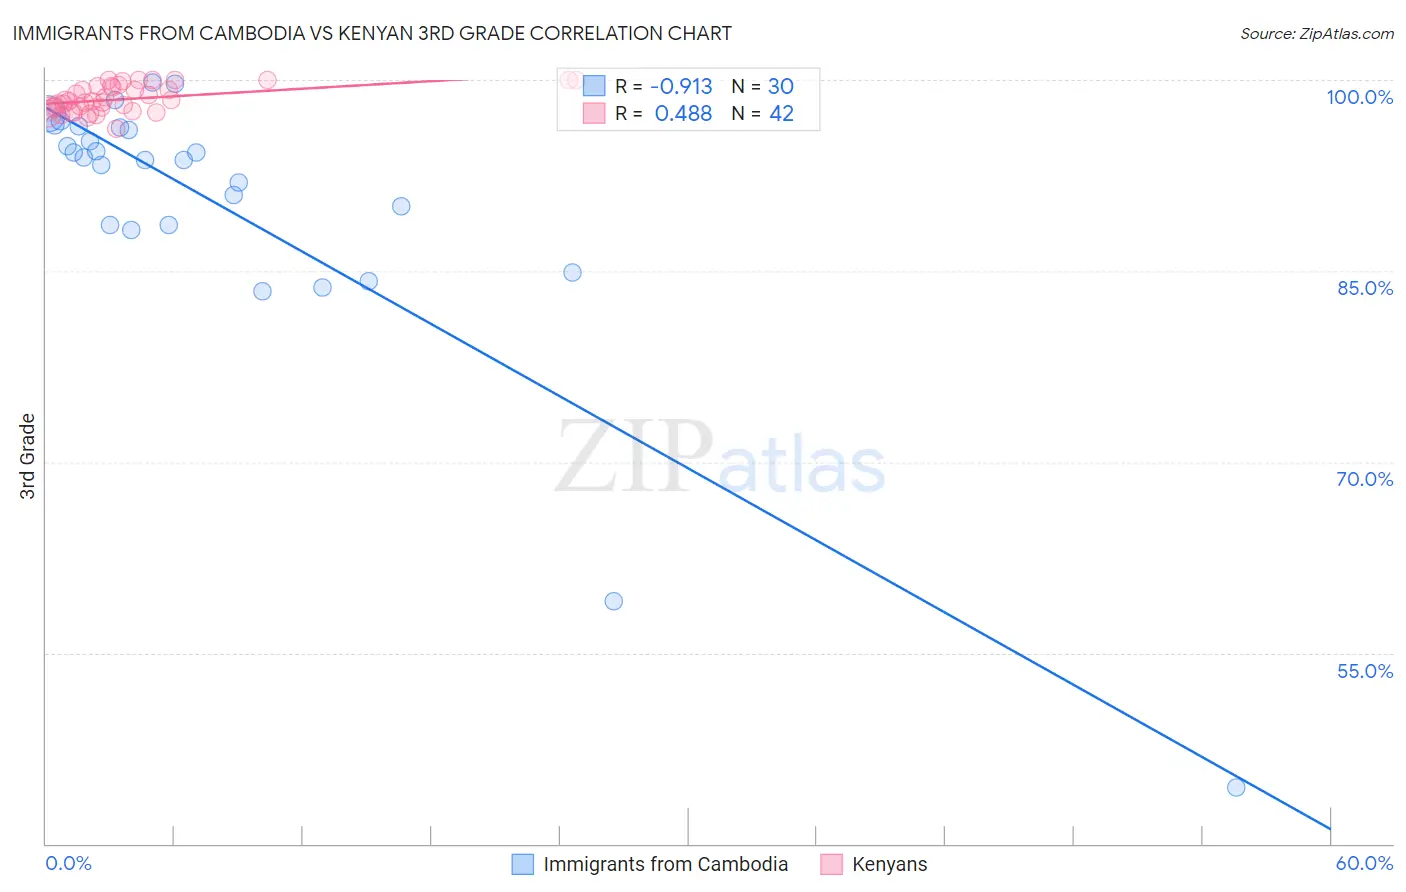
Immigrants from Cambodia vs Kenyan 3rd Grade Correlation Chart
The statistical analysis conducted on geographies consisting of 205,153,442 people shows a near-perfect negative correlation between the proportion of Immigrants from Cambodia and percentage of population with at least 3rd grade education in the United States with a correlation coefficient (R) of -0.913 and weighted average of 96.2%. Similarly, the statistical analysis conducted on geographies consisting of 168,244,481 people shows a moderate positive correlation between the proportion of Kenyans and percentage of population with at least 3rd grade education in the United States with a correlation coefficient (R) of 0.488 and weighted average of 97.8%, a difference of 1.7%.
3rd Grade Correlation Summary
| Measurement | Immigrants from Cambodia | Kenyan |
| Minimum | 44.4% | 96.2% |
| Maximum | 99.8% | 100.0% |
| Range | 55.4% | 3.8% |
| Mean | 90.1% | 98.5% |
| Median | 93.8% | 98.3% |
| Interquartile 25% (IQ1) | 88.6% | 97.7% |
| Interquartile 75% (IQ3) | 96.2% | 99.5% |
| Interquartile Range (IQR) | 7.6% | 1.8% |
| Standard Deviation (Sample) | 11.6% | 1.0% |
| Standard Deviation (Population) | 11.4% | 1.0% |
Similar Demographics by 3rd Grade
Demographics Similar to Immigrants from Cambodia by 3rd Grade
In terms of 3rd grade, the demographic groups most similar to Immigrants from Cambodia are Immigrants from Dominican Republic (96.2%, a difference of 0.0%), Immigrants from Fiji (96.2%, a difference of 0.020%), Immigrants from Cabo Verde (96.2%, a difference of 0.020%), Mexican (96.2%, a difference of 0.050%), and Immigrants from Latin America (96.2%, a difference of 0.060%).
| Demographics | Rating | Rank | 3rd Grade |
| Japanese | 0.0 /100 | #327 | Tragic 96.4% |
| Bangladeshis | 0.0 /100 | #328 | Tragic 96.3% |
| Immigrants | Honduras | 0.0 /100 | #329 | Tragic 96.3% |
| Immigrants | Armenia | 0.0 /100 | #330 | Tragic 96.3% |
| Immigrants | Latin America | 0.0 /100 | #331 | Tragic 96.2% |
| Mexicans | 0.0 /100 | #332 | Tragic 96.2% |
| Immigrants | Fiji | 0.0 /100 | #333 | Tragic 96.2% |
| Immigrants | Cambodia | 0.0 /100 | #334 | Tragic 96.2% |
| Immigrants | Dominican Republic | 0.0 /100 | #335 | Tragic 96.2% |
| Immigrants | Cabo Verde | 0.0 /100 | #336 | Tragic 96.2% |
| Central Americans | 0.0 /100 | #337 | Tragic 96.1% |
| Guatemalans | 0.0 /100 | #338 | Tragic 96.0% |
| Yakama | 0.0 /100 | #339 | Tragic 95.9% |
| Nepalese | 0.0 /100 | #340 | Tragic 95.9% |
| Immigrants | Central America | 0.0 /100 | #341 | Tragic 95.8% |
Demographics Similar to Kenyans by 3rd Grade
In terms of 3rd grade, the demographic groups most similar to Kenyans are Spanish American (97.8%, a difference of 0.0%), Immigrants from Korea (97.8%, a difference of 0.0%), Immigrants from Bosnia and Herzegovina (97.8%, a difference of 0.010%), Ugandan (97.8%, a difference of 0.010%), and Dutch West Indian (97.8%, a difference of 0.010%).
| Demographics | Rating | Rank | 3rd Grade |
| Immigrants | Bosnia and Herzegovina | 56.2 /100 | #164 | Average 97.8% |
| Ugandans | 56.1 /100 | #165 | Average 97.8% |
| Dutch West Indians | 55.5 /100 | #166 | Average 97.8% |
| Chileans | 55.3 /100 | #167 | Average 97.8% |
| Immigrants | Spain | 54.3 /100 | #168 | Average 97.8% |
| Comanche | 53.8 /100 | #169 | Average 97.8% |
| Brazilians | 53.7 /100 | #170 | Average 97.8% |
| Kenyans | 51.8 /100 | #171 | Average 97.8% |
| Spanish Americans | 51.8 /100 | #172 | Average 97.8% |
| Immigrants | Korea | 50.9 /100 | #173 | Average 97.8% |
| Navajo | 50.0 /100 | #174 | Average 97.8% |
| Immigrants | Micronesia | 47.6 /100 | #175 | Average 97.8% |
| Immigrants | Poland | 47.1 /100 | #176 | Average 97.8% |
| Egyptians | 46.6 /100 | #177 | Average 97.7% |
| Immigrants | Brazil | 46.4 /100 | #178 | Average 97.7% |