Cuban vs Immigrants from Western Europe Unemployment Among Ages 25 to 29 years
COMPARE
Cuban
Immigrants from Western Europe
Unemployment Among Ages 25 to 29 years
Unemployment Among Ages 25 to 29 years Comparison
Cubans
Immigrants from Western Europe
5.9%
UNEMPLOYMENT AMONG AGES 25 TO 29 YEARS
99.9/ 100
METRIC RATING
15th/ 347
METRIC RANK
6.7%
UNEMPLOYMENT AMONG AGES 25 TO 29 YEARS
41.1/ 100
METRIC RATING
181st/ 347
METRIC RANK
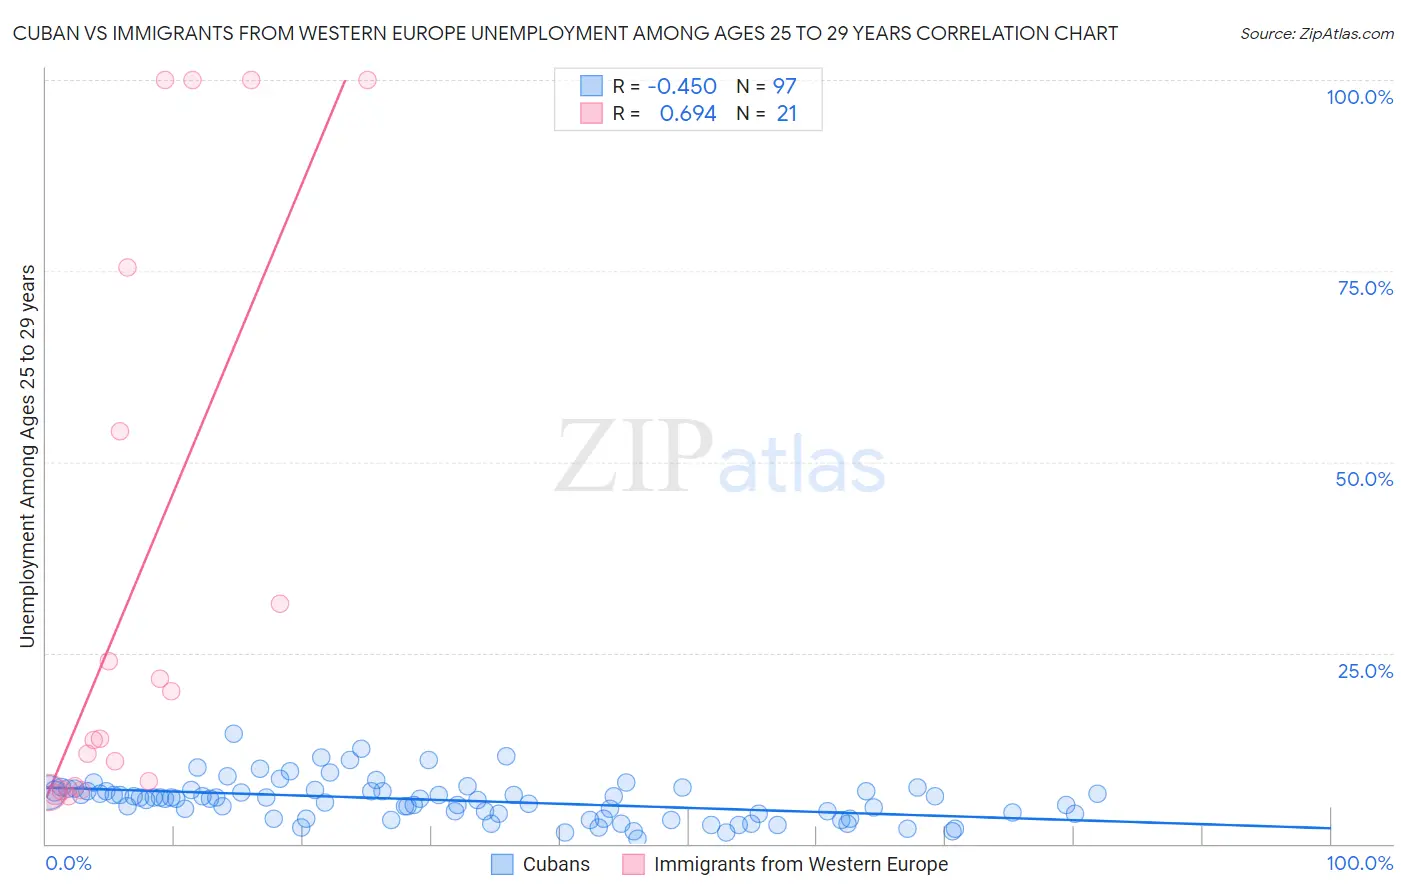
Cuban vs Immigrants from Western Europe Unemployment Among Ages 25 to 29 years Correlation Chart
The statistical analysis conducted on geographies consisting of 424,519,205 people shows a moderate negative correlation between the proportion of Cubans and unemployment rate among population between the ages 25 and 29 in the United States with a correlation coefficient (R) of -0.450 and weighted average of 5.9%. Similarly, the statistical analysis conducted on geographies consisting of 457,284,196 people shows a significant positive correlation between the proportion of Immigrants from Western Europe and unemployment rate among population between the ages 25 and 29 in the United States with a correlation coefficient (R) of 0.694 and weighted average of 6.7%, a difference of 13.1%.
Unemployment Among Ages 25 to 29 years Correlation Summary
| Measurement | Cuban | Immigrants from Western Europe |
| Minimum | 0.70% | 6.2% |
| Maximum | 14.4% | 100.0% |
| Range | 13.7% | 93.8% |
| Mean | 5.7% | 34.5% |
| Median | 5.9% | 13.8% |
| Interquartile 25% (IQ1) | 3.6% | 7.3% |
| Interquartile 75% (IQ3) | 6.9% | 64.7% |
| Interquartile Range (IQR) | 3.3% | 57.4% |
| Standard Deviation (Sample) | 2.6% | 36.7% |
| Standard Deviation (Population) | 2.6% | 35.8% |
Similar Demographics by Unemployment Among Ages 25 to 29 years
Demographics Similar to Cubans by Unemployment Among Ages 25 to 29 years
In terms of unemployment among ages 25 to 29 years, the demographic groups most similar to Cubans are Immigrants from Bulgaria (5.9%, a difference of 0.010%), Bolivian (5.9%, a difference of 0.15%), Immigrants from Singapore (5.9%, a difference of 0.26%), Immigrants from Kuwait (5.9%, a difference of 0.35%), and Thai (5.9%, a difference of 0.41%).
| Demographics | Rating | Rank | Unemployment Among Ages 25 to 29 years |
| Immigrants | Bosnia and Herzegovina | 100.0 /100 | #8 | Exceptional 5.7% |
| Immigrants | Nepal | 100.0 /100 | #9 | Exceptional 5.7% |
| Immigrants | Sudan | 100.0 /100 | #10 | Exceptional 5.8% |
| Cambodians | 100.0 /100 | #11 | Exceptional 5.8% |
| Okinawans | 100.0 /100 | #12 | Exceptional 5.9% |
| Immigrants | Bolivia | 100.0 /100 | #13 | Exceptional 5.9% |
| Immigrants | Kuwait | 99.9 /100 | #14 | Exceptional 5.9% |
| Cubans | 99.9 /100 | #15 | Exceptional 5.9% |
| Immigrants | Bulgaria | 99.9 /100 | #16 | Exceptional 5.9% |
| Bolivians | 99.9 /100 | #17 | Exceptional 5.9% |
| Immigrants | Singapore | 99.9 /100 | #18 | Exceptional 5.9% |
| Thais | 99.9 /100 | #19 | Exceptional 5.9% |
| Immigrants | Eritrea | 99.9 /100 | #20 | Exceptional 5.9% |
| Immigrants | Ethiopia | 99.9 /100 | #21 | Exceptional 6.0% |
| Immigrants | Japan | 99.9 /100 | #22 | Exceptional 6.0% |
Demographics Similar to Immigrants from Western Europe by Unemployment Among Ages 25 to 29 years
In terms of unemployment among ages 25 to 29 years, the demographic groups most similar to Immigrants from Western Europe are Immigrants from Africa (6.7%, a difference of 0.0%), Czechoslovakian (6.7%, a difference of 0.020%), Immigrants from Scotland (6.7%, a difference of 0.090%), Immigrants from Costa Rica (6.7%, a difference of 0.18%), and Costa Rican (6.7%, a difference of 0.24%).
| Demographics | Rating | Rank | Unemployment Among Ages 25 to 29 years |
| Immigrants | North America | 50.0 /100 | #174 | Average 6.6% |
| Immigrants | South Eastern Asia | 49.1 /100 | #175 | Average 6.7% |
| Osage | 48.1 /100 | #176 | Average 6.7% |
| Immigrants | Israel | 47.8 /100 | #177 | Average 6.7% |
| Immigrants | Iraq | 45.1 /100 | #178 | Average 6.7% |
| Costa Ricans | 44.9 /100 | #179 | Average 6.7% |
| Immigrants | Africa | 41.1 /100 | #180 | Average 6.7% |
| Immigrants | Western Europe | 41.1 /100 | #181 | Average 6.7% |
| Czechoslovakians | 40.7 /100 | #182 | Average 6.7% |
| Immigrants | Scotland | 39.6 /100 | #183 | Fair 6.7% |
| Immigrants | Costa Rica | 38.3 /100 | #184 | Fair 6.7% |
| Moroccans | 35.9 /100 | #185 | Fair 6.7% |
| Immigrants | Iran | 34.4 /100 | #186 | Fair 6.7% |
| Immigrants | South America | 33.0 /100 | #187 | Fair 6.7% |
| Irish | 32.8 /100 | #188 | Fair 6.7% |