Immigrants from Sri Lanka vs Immigrants from Italy 1st Grade
COMPARE
Immigrants from Sri Lanka
Immigrants from Italy
1st Grade
1st Grade Comparison
Immigrants from Sri Lanka
Immigrants from Italy
97.9%
1ST GRADE
49.7/ 100
METRIC RATING
175th/ 347
METRIC RANK
97.9%
1ST GRADE
59.1/ 100
METRIC RATING
161st/ 347
METRIC RANK
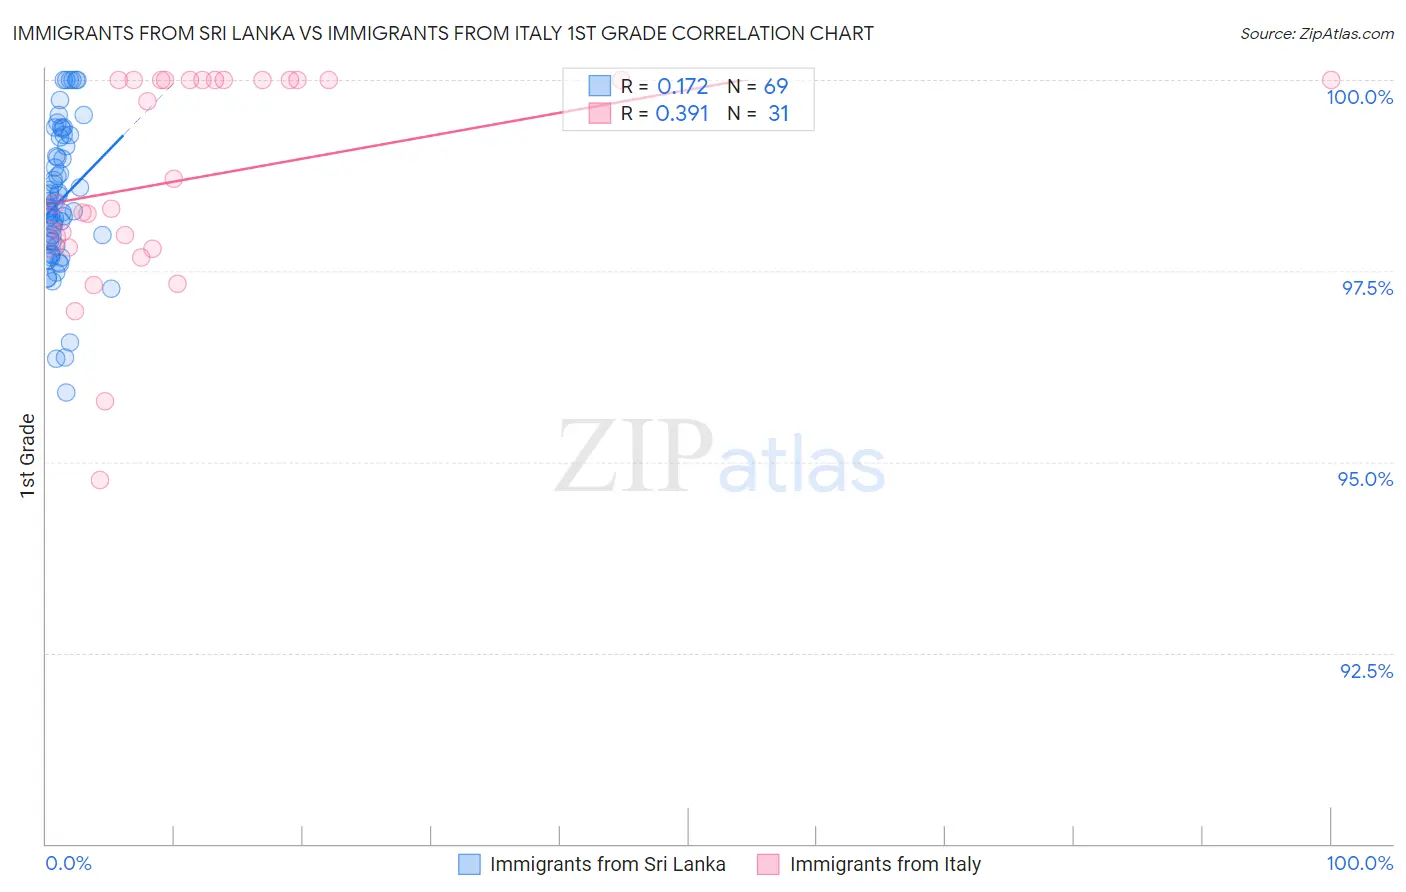
Immigrants from Sri Lanka vs Immigrants from Italy 1st Grade Correlation Chart
The statistical analysis conducted on geographies consisting of 149,700,552 people shows a poor positive correlation between the proportion of Immigrants from Sri Lanka and percentage of population with at least 1st grade education in the United States with a correlation coefficient (R) of 0.172 and weighted average of 97.9%. Similarly, the statistical analysis conducted on geographies consisting of 324,225,917 people shows a mild positive correlation between the proportion of Immigrants from Italy and percentage of population with at least 1st grade education in the United States with a correlation coefficient (R) of 0.391 and weighted average of 97.9%, a difference of 0.030%.
1st Grade Correlation Summary
| Measurement | Immigrants from Sri Lanka | Immigrants from Italy |
| Minimum | 95.9% | 94.8% |
| Maximum | 100.0% | 100.0% |
| Range | 4.1% | 5.2% |
| Mean | 98.4% | 98.7% |
| Median | 98.3% | 98.7% |
| Interquartile 25% (IQ1) | 97.8% | 97.8% |
| Interquartile 75% (IQ3) | 99.2% | 100.0% |
| Interquartile Range (IQR) | 1.4% | 2.2% |
| Standard Deviation (Sample) | 0.93% | 1.4% |
| Standard Deviation (Population) | 0.92% | 1.4% |
Demographics Similar to Immigrants from Sri Lanka and Immigrants from Italy by 1st Grade
In terms of 1st grade, the demographic groups most similar to Immigrants from Sri Lanka are Kenyan (97.9%, a difference of 0.0%), Native/Alaskan (97.9%, a difference of 0.0%), Albanian (97.9%, a difference of 0.0%), Immigrants from Brazil (97.9%, a difference of 0.0%), and Immigrants from Jordan (97.9%, a difference of 0.010%). Similarly, the demographic groups most similar to Immigrants from Italy are Immigrants from Russia (97.9%, a difference of 0.0%), Immigrants from Eastern Europe (97.9%, a difference of 0.0%), Spanish American (97.9%, a difference of 0.0%), Brazilian (97.9%, a difference of 0.0%), and Ugandan (97.9%, a difference of 0.010%).
| Demographics | Rating | Rank | 1st Grade |
| Venezuelans | 64.7 /100 | #158 | Good 98.0% |
| French American Indians | 63.7 /100 | #159 | Good 98.0% |
| Immigrants | Russia | 59.2 /100 | #160 | Average 97.9% |
| Immigrants | Italy | 59.1 /100 | #161 | Average 97.9% |
| Immigrants | Eastern Europe | 58.9 /100 | #162 | Average 97.9% |
| Spanish Americans | 57.7 /100 | #163 | Average 97.9% |
| Brazilians | 57.6 /100 | #164 | Average 97.9% |
| Ugandans | 56.9 /100 | #165 | Average 97.9% |
| Navajo | 56.6 /100 | #166 | Average 97.9% |
| Bermudans | 56.3 /100 | #167 | Average 97.9% |
| Chileans | 55.6 /100 | #168 | Average 97.9% |
| Immigrants | Micronesia | 55.3 /100 | #169 | Average 97.9% |
| Immigrants | Spain | 54.9 /100 | #170 | Average 97.9% |
| Immigrants | Jordan | 53.9 /100 | #171 | Average 97.9% |
| Immigrants | Korea | 53.0 /100 | #172 | Average 97.9% |
| Kenyans | 51.2 /100 | #173 | Average 97.9% |
| Natives/Alaskans | 50.0 /100 | #174 | Average 97.9% |
| Immigrants | Sri Lanka | 49.7 /100 | #175 | Average 97.9% |
| Albanians | 49.6 /100 | #176 | Average 97.9% |
| Immigrants | Brazil | 49.1 /100 | #177 | Average 97.9% |
| Immigrants | Venezuela | 47.8 /100 | #178 | Average 97.9% |