Guamanian/Chamorro vs Immigrants from Albania 5th Grade
COMPARE
Guamanian/Chamorro
Immigrants from Albania
5th Grade
5th Grade Comparison
Guamanians/Chamorros
Immigrants from Albania
97.2%
5TH GRADE
26.8/ 100
METRIC RATING
195th/ 347
METRIC RANK
97.2%
5TH GRADE
28.5/ 100
METRIC RATING
194th/ 347
METRIC RANK
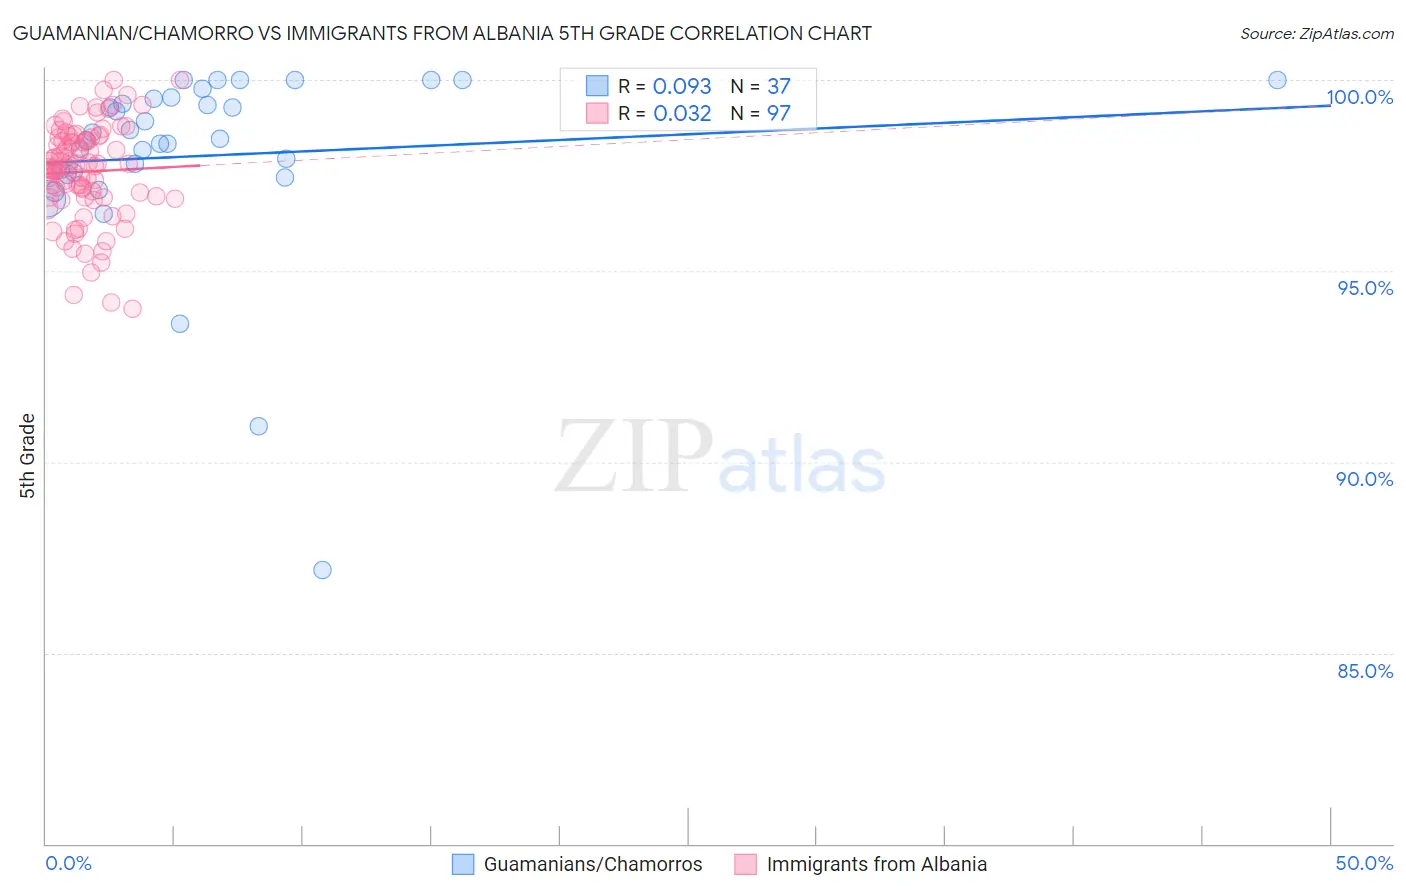
Guamanian/Chamorro vs Immigrants from Albania 5th Grade Correlation Chart
The statistical analysis conducted on geographies consisting of 221,965,618 people shows a slight positive correlation between the proportion of Guamanians/Chamorros and percentage of population with at least 5th grade education in the United States with a correlation coefficient (R) of 0.093 and weighted average of 97.2%. Similarly, the statistical analysis conducted on geographies consisting of 119,265,453 people shows no correlation between the proportion of Immigrants from Albania and percentage of population with at least 5th grade education in the United States with a correlation coefficient (R) of 0.032 and weighted average of 97.2%, a difference of 0.010%.
5th Grade Correlation Summary
| Measurement | Guamanian/Chamorro | Immigrants from Albania |
| Minimum | 87.2% | 94.0% |
| Maximum | 100.0% | 100.0% |
| Range | 12.8% | 6.0% |
| Mean | 98.0% | 97.6% |
| Median | 98.5% | 97.7% |
| Interquartile 25% (IQ1) | 97.5% | 96.9% |
| Interquartile 75% (IQ3) | 99.5% | 98.5% |
| Interquartile Range (IQR) | 2.0% | 1.5% |
| Standard Deviation (Sample) | 2.6% | 1.3% |
| Standard Deviation (Population) | 2.5% | 1.2% |
Demographics Similar to Guamanians/Chamorros and Immigrants from Albania by 5th Grade
In terms of 5th grade, the demographic groups most similar to Guamanians/Chamorros are Navajo (97.2%, a difference of 0.010%), Hawaiian (97.2%, a difference of 0.010%), Brazilian (97.2%, a difference of 0.010%), Immigrants from Brazil (97.3%, a difference of 0.020%), and Panamanian (97.3%, a difference of 0.020%). Similarly, the demographic groups most similar to Immigrants from Albania are Navajo (97.2%, a difference of 0.0%), Immigrants from Brazil (97.3%, a difference of 0.010%), Panamanian (97.3%, a difference of 0.010%), Immigrants from Egypt (97.3%, a difference of 0.020%), and Black/African American (97.3%, a difference of 0.020%).
| Demographics | Rating | Rank | 5th Grade |
| Immigrants | Venezuela | 38.4 /100 | #184 | Fair 97.3% |
| Dutch West Indians | 36.2 /100 | #185 | Fair 97.3% |
| Immigrants | Argentina | 36.1 /100 | #186 | Fair 97.3% |
| Spanish Americans | 34.7 /100 | #187 | Fair 97.3% |
| Paraguayans | 33.7 /100 | #188 | Fair 97.3% |
| Immigrants | Egypt | 32.9 /100 | #189 | Fair 97.3% |
| Blacks/African Americans | 31.8 /100 | #190 | Fair 97.3% |
| Immigrants | Brazil | 31.5 /100 | #191 | Fair 97.3% |
| Panamanians | 31.3 /100 | #192 | Fair 97.3% |
| Navajo | 29.0 /100 | #193 | Fair 97.2% |
| Immigrants | Albania | 28.5 /100 | #194 | Fair 97.2% |
| Guamanians/Chamorros | 26.8 /100 | #195 | Fair 97.2% |
| Hawaiians | 25.6 /100 | #196 | Fair 97.2% |
| Brazilians | 25.4 /100 | #197 | Fair 97.2% |
| Immigrants | Uganda | 21.1 /100 | #198 | Fair 97.2% |
| Natives/Alaskans | 18.0 /100 | #199 | Poor 97.2% |
| Immigrants | Northern Africa | 16.8 /100 | #200 | Poor 97.2% |
| Immigrants | Chile | 16.6 /100 | #201 | Poor 97.2% |
| Africans | 15.3 /100 | #202 | Poor 97.2% |
| Immigrants | Bahamas | 14.9 /100 | #203 | Poor 97.2% |
| Immigrants | Zaire | 13.7 /100 | #204 | Poor 97.1% |