Cuban vs Immigrants from Turkey 5th Grade
COMPARE
Cuban
Immigrants from Turkey
5th Grade
5th Grade Comparison
Cubans
Immigrants from Turkey
96.6%
5TH GRADE
0.1/ 100
METRIC RATING
276th/ 347
METRIC RANK
97.5%
5TH GRADE
86.7/ 100
METRIC RATING
139th/ 347
METRIC RANK
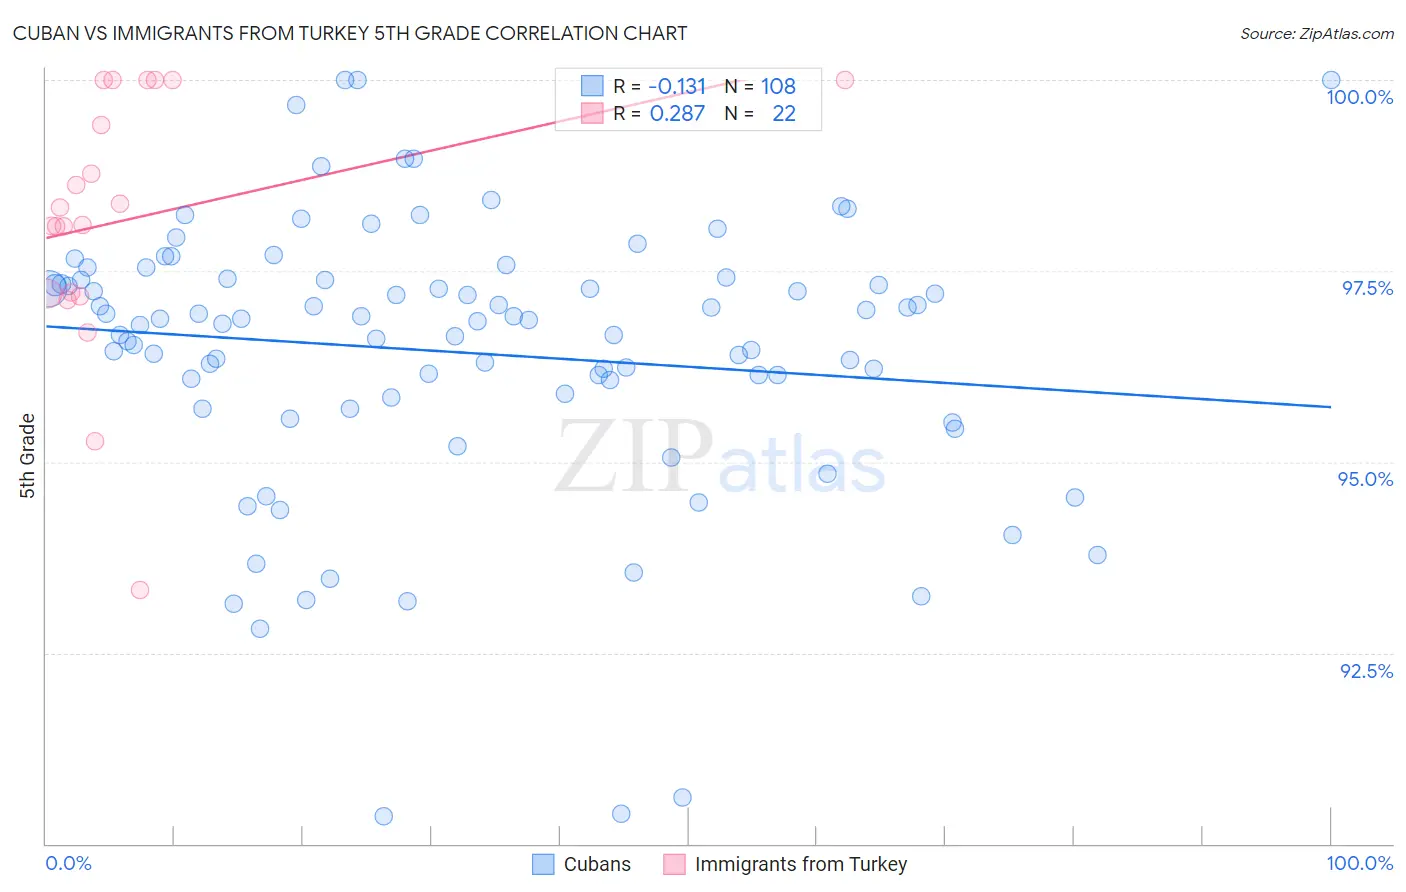
Cuban vs Immigrants from Turkey 5th Grade Correlation Chart
The statistical analysis conducted on geographies consisting of 449,326,865 people shows a poor negative correlation between the proportion of Cubans and percentage of population with at least 5th grade education in the United States with a correlation coefficient (R) of -0.131 and weighted average of 96.6%. Similarly, the statistical analysis conducted on geographies consisting of 223,057,877 people shows a weak positive correlation between the proportion of Immigrants from Turkey and percentage of population with at least 5th grade education in the United States with a correlation coefficient (R) of 0.287 and weighted average of 97.5%, a difference of 0.90%.
5th Grade Correlation Summary
| Measurement | Cuban | Immigrants from Turkey |
| Minimum | 90.4% | 93.3% |
| Maximum | 100.0% | 100.0% |
| Range | 9.6% | 6.7% |
| Mean | 96.4% | 98.2% |
| Median | 96.9% | 98.2% |
| Interquartile 25% (IQ1) | 95.9% | 97.2% |
| Interquartile 75% (IQ3) | 97.4% | 100.0% |
| Interquartile Range (IQR) | 1.5% | 2.8% |
| Standard Deviation (Sample) | 1.8% | 1.7% |
| Standard Deviation (Population) | 1.8% | 1.7% |
Similar Demographics by 5th Grade
Demographics Similar to Cubans by 5th Grade
In terms of 5th grade, the demographic groups most similar to Cubans are Immigrants from Peru (96.6%, a difference of 0.0%), Immigrants from Bolivia (96.6%, a difference of 0.0%), Yaqui (96.7%, a difference of 0.010%), Immigrants from Cameroon (96.7%, a difference of 0.010%), and Immigrants from Ghana (96.6%, a difference of 0.010%).
| Demographics | Rating | Rank | 5th Grade |
| Ghanaians | 0.2 /100 | #269 | Tragic 96.7% |
| Afghans | 0.2 /100 | #270 | Tragic 96.7% |
| Immigrants | Hong Kong | 0.2 /100 | #271 | Tragic 96.7% |
| Trinidadians and Tobagonians | 0.1 /100 | #272 | Tragic 96.7% |
| Yaqui | 0.1 /100 | #273 | Tragic 96.7% |
| Immigrants | Cameroon | 0.1 /100 | #274 | Tragic 96.7% |
| Immigrants | Peru | 0.1 /100 | #275 | Tragic 96.6% |
| Cubans | 0.1 /100 | #276 | Tragic 96.6% |
| Immigrants | Bolivia | 0.1 /100 | #277 | Tragic 96.6% |
| Immigrants | Ghana | 0.1 /100 | #278 | Tragic 96.6% |
| Immigrants | Philippines | 0.1 /100 | #279 | Tragic 96.6% |
| Immigrants | Western Africa | 0.1 /100 | #280 | Tragic 96.6% |
| Houma | 0.1 /100 | #281 | Tragic 96.6% |
| Barbadians | 0.1 /100 | #282 | Tragic 96.6% |
| Fijians | 0.1 /100 | #283 | Tragic 96.6% |
Demographics Similar to Immigrants from Turkey by 5th Grade
In terms of 5th grade, the demographic groups most similar to Immigrants from Turkey are Filipino (97.5%, a difference of 0.0%), Blackfeet (97.5%, a difference of 0.0%), Immigrants from Moldova (97.5%, a difference of 0.010%), Burmese (97.5%, a difference of 0.010%), and Seminole (97.5%, a difference of 0.010%).
| Demographics | Rating | Rank | 5th Grade |
| Immigrants | Kuwait | 90.4 /100 | #132 | Exceptional 97.6% |
| Cambodians | 90.2 /100 | #133 | Exceptional 97.6% |
| Immigrants | Hungary | 90.1 /100 | #134 | Exceptional 97.6% |
| Palestinians | 89.3 /100 | #135 | Excellent 97.5% |
| Immigrants | Moldova | 87.5 /100 | #136 | Excellent 97.5% |
| Filipinos | 86.8 /100 | #137 | Excellent 97.5% |
| Blackfeet | 86.8 /100 | #138 | Excellent 97.5% |
| Immigrants | Turkey | 86.7 /100 | #139 | Excellent 97.5% |
| Burmese | 86.1 /100 | #140 | Excellent 97.5% |
| Seminole | 85.8 /100 | #141 | Excellent 97.5% |
| Israelis | 85.5 /100 | #142 | Excellent 97.5% |
| Immigrants | North Macedonia | 85.4 /100 | #143 | Excellent 97.5% |
| Immigrants | Greece | 83.2 /100 | #144 | Excellent 97.5% |
| Jordanians | 82.6 /100 | #145 | Excellent 97.5% |
| Spaniards | 81.9 /100 | #146 | Excellent 97.5% |