Creek vs French College, 1 year or more
COMPARE
Creek
French
College, 1 year or more
College, 1 year or more Comparison
Creek
French
52.2%
COLLEGE, 1 YEAR OR MORE
0.0/ 100
METRIC RATING
303rd/ 347
METRIC RANK
58.9%
COLLEGE, 1 YEAR OR MORE
34.4/ 100
METRIC RATING
188th/ 347
METRIC RANK
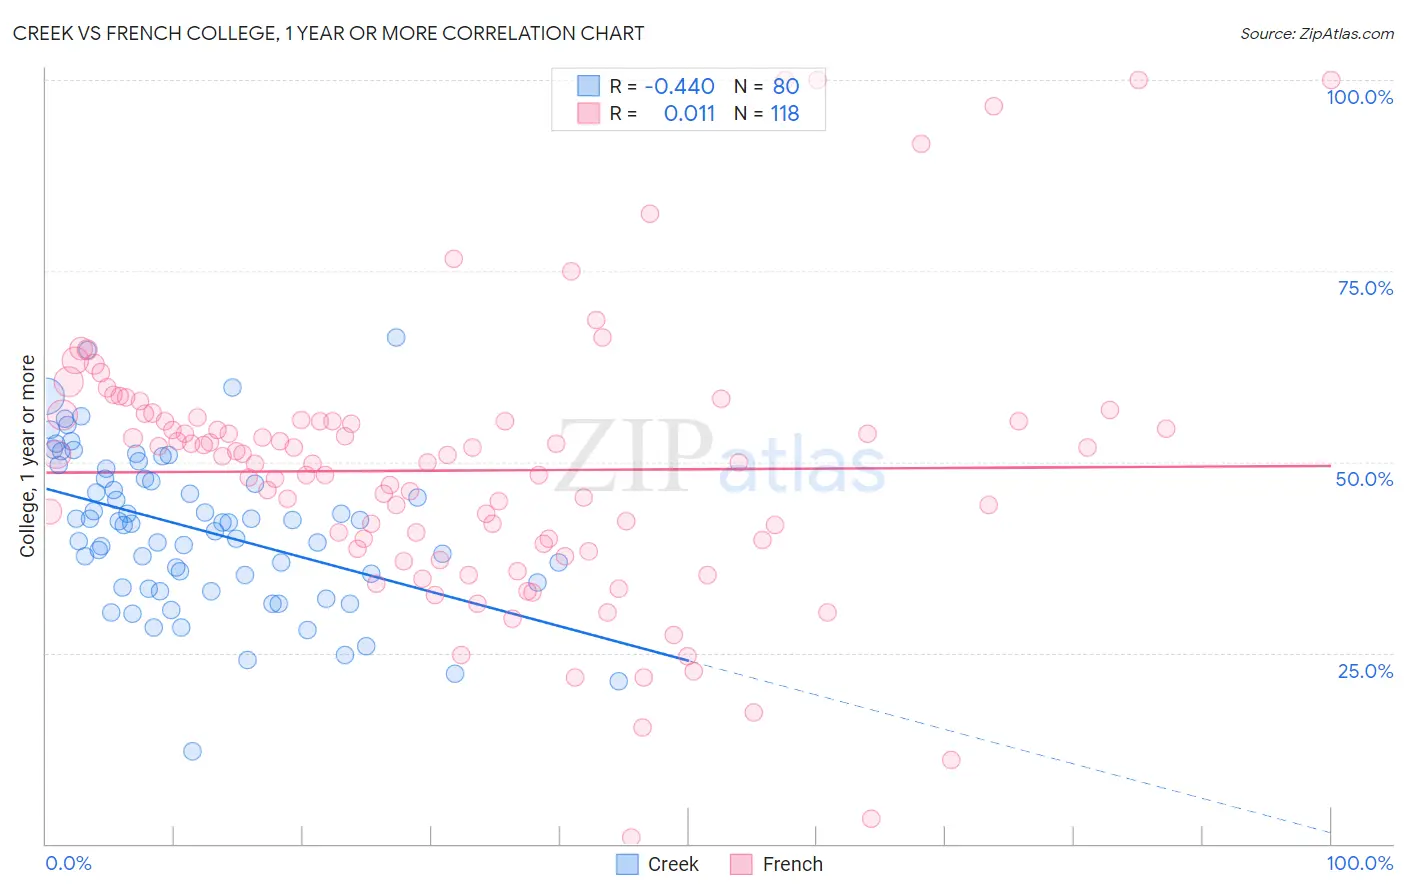
Creek vs French College, 1 year or more Correlation Chart
The statistical analysis conducted on geographies consisting of 178,480,714 people shows a moderate negative correlation between the proportion of Creek and percentage of population with at least college, 1 year or more education in the United States with a correlation coefficient (R) of -0.440 and weighted average of 52.2%. Similarly, the statistical analysis conducted on geographies consisting of 572,417,926 people shows no correlation between the proportion of French and percentage of population with at least college, 1 year or more education in the United States with a correlation coefficient (R) of 0.011 and weighted average of 58.9%, a difference of 12.8%.
College, 1 year or more Correlation Summary
| Measurement | Creek | French |
| Minimum | 12.0% | 0.78% |
| Maximum | 66.3% | 100.0% |
| Range | 54.2% | 99.2% |
| Mean | 41.1% | 48.9% |
| Median | 42.0% | 50.4% |
| Interquartile 25% (IQ1) | 33.9% | 39.3% |
| Interquartile 75% (IQ3) | 47.8% | 55.4% |
| Interquartile Range (IQR) | 13.9% | 16.1% |
| Standard Deviation (Sample) | 10.1% | 17.8% |
| Standard Deviation (Population) | 10.1% | 17.7% |
Similar Demographics by College, 1 year or more
Demographics Similar to Creek by College, 1 year or more
In terms of college, 1 year or more, the demographic groups most similar to Creek are Puerto Rican (52.2%, a difference of 0.080%), Central American (52.1%, a difference of 0.14%), Haitian (52.3%, a difference of 0.21%), Seminole (52.1%, a difference of 0.23%), and Choctaw (52.3%, a difference of 0.26%).
| Demographics | Rating | Rank | College, 1 year or more |
| Sioux | 0.0 /100 | #296 | Tragic 53.0% |
| Paiute | 0.0 /100 | #297 | Tragic 52.9% |
| Immigrants | Dominica | 0.0 /100 | #298 | Tragic 52.5% |
| Immigrants | Nicaragua | 0.0 /100 | #299 | Tragic 52.4% |
| Choctaw | 0.0 /100 | #300 | Tragic 52.3% |
| Haitians | 0.0 /100 | #301 | Tragic 52.3% |
| Puerto Ricans | 0.0 /100 | #302 | Tragic 52.2% |
| Creek | 0.0 /100 | #303 | Tragic 52.2% |
| Central Americans | 0.0 /100 | #304 | Tragic 52.1% |
| Seminole | 0.0 /100 | #305 | Tragic 52.1% |
| Mexican American Indians | 0.0 /100 | #306 | Tragic 51.9% |
| Immigrants | Portugal | 0.0 /100 | #307 | Tragic 51.9% |
| Salvadorans | 0.0 /100 | #308 | Tragic 51.8% |
| Apache | 0.0 /100 | #309 | Tragic 51.8% |
| Hondurans | 0.0 /100 | #310 | Tragic 51.6% |
Demographics Similar to French by College, 1 year or more
In terms of college, 1 year or more, the demographic groups most similar to French are Scotch-Irish (58.9%, a difference of 0.020%), German (58.9%, a difference of 0.020%), South American (59.0%, a difference of 0.090%), Uruguayan (58.8%, a difference of 0.15%), and Immigrants from Cameroon (58.8%, a difference of 0.19%).
| Demographics | Rating | Rank | College, 1 year or more |
| Swiss | 43.4 /100 | #181 | Average 59.2% |
| Immigrants | Bosnia and Herzegovina | 42.8 /100 | #182 | Average 59.2% |
| German Russians | 39.3 /100 | #183 | Fair 59.1% |
| Spaniards | 38.3 /100 | #184 | Fair 59.0% |
| South Americans | 35.9 /100 | #185 | Fair 59.0% |
| Scotch-Irish | 34.7 /100 | #186 | Fair 58.9% |
| Germans | 34.7 /100 | #187 | Fair 58.9% |
| French | 34.4 /100 | #188 | Fair 58.9% |
| Uruguayans | 31.8 /100 | #189 | Fair 58.8% |
| Immigrants | Cameroon | 31.2 /100 | #190 | Fair 58.8% |
| Immigrants | Philippines | 29.2 /100 | #191 | Fair 58.7% |
| Colombians | 27.6 /100 | #192 | Fair 58.7% |
| Peruvians | 27.5 /100 | #193 | Fair 58.6% |
| Costa Ricans | 26.4 /100 | #194 | Fair 58.6% |
| Dutch | 26.2 /100 | #195 | Fair 58.6% |