Creek vs French Canadian Kindergarten
COMPARE
Creek
French Canadian
Kindergarten
Kindergarten Comparison
Creek
French Canadians
98.4%
KINDERGARTEN
99.7/ 100
METRIC RATING
60th/ 347
METRIC RANK
98.6%
KINDERGARTEN
100.0/ 100
METRIC RATING
32nd/ 347
METRIC RANK
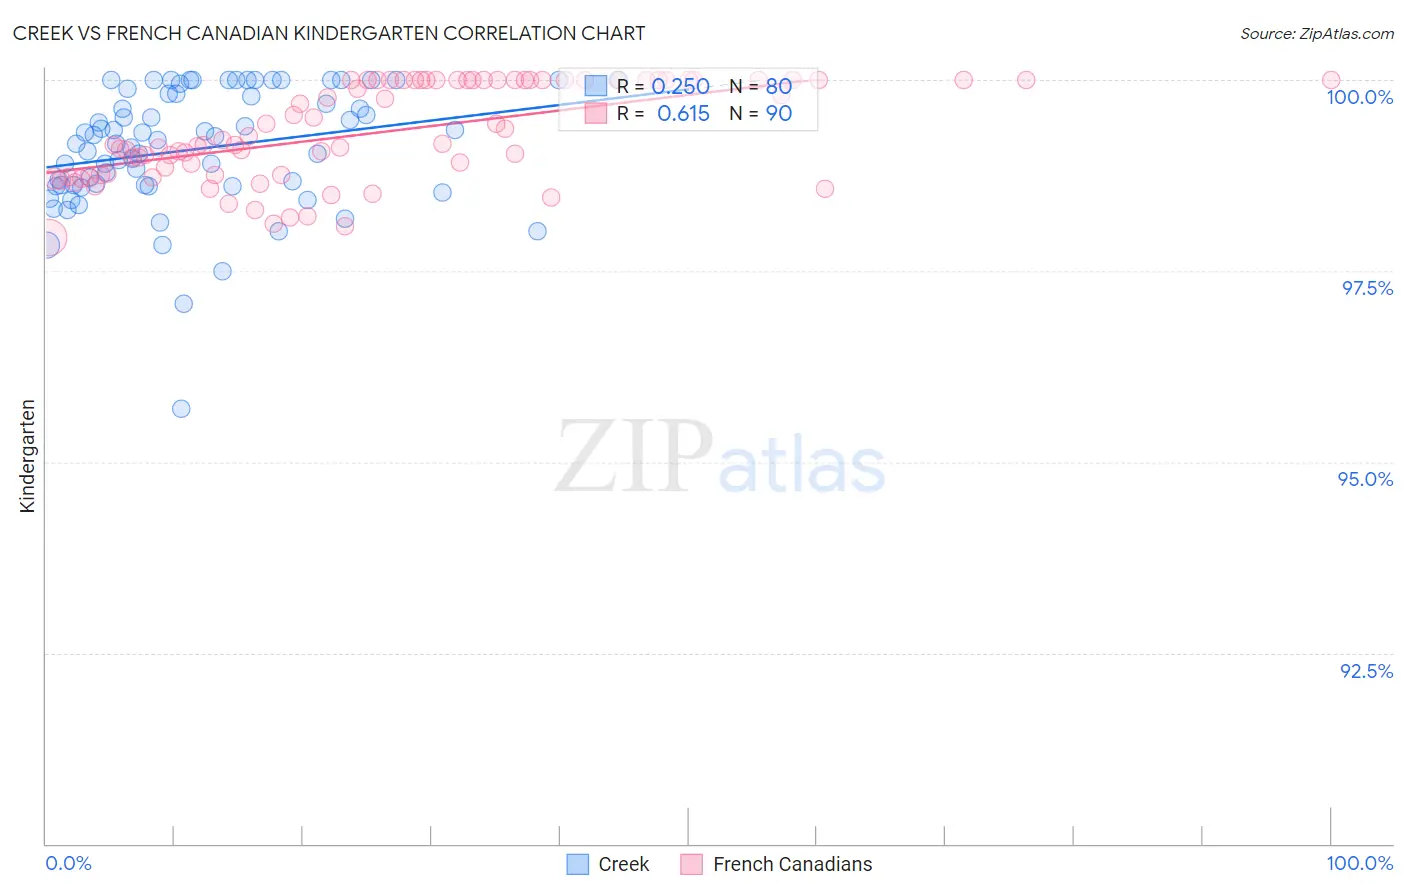
Creek vs French Canadian Kindergarten Correlation Chart
The statistical analysis conducted on geographies consisting of 178,480,663 people shows a weak positive correlation between the proportion of Creek and percentage of population with at least kindergarten education in the United States with a correlation coefficient (R) of 0.250 and weighted average of 98.4%. Similarly, the statistical analysis conducted on geographies consisting of 502,680,064 people shows a significant positive correlation between the proportion of French Canadians and percentage of population with at least kindergarten education in the United States with a correlation coefficient (R) of 0.615 and weighted average of 98.6%, a difference of 0.17%.
Kindergarten Correlation Summary
| Measurement | Creek | French Canadian |
| Minimum | 95.7% | 97.9% |
| Maximum | 100.0% | 100.0% |
| Range | 4.3% | 2.1% |
| Mean | 99.1% | 99.3% |
| Median | 99.2% | 99.2% |
| Interquartile 25% (IQ1) | 98.6% | 98.8% |
| Interquartile 75% (IQ3) | 99.8% | 100.0% |
| Interquartile Range (IQR) | 1.2% | 1.2% |
| Standard Deviation (Sample) | 0.80% | 0.63% |
| Standard Deviation (Population) | 0.80% | 0.62% |
Similar Demographics by Kindergarten
Demographics Similar to Creek by Kindergarten
In terms of kindergarten, the demographic groups most similar to Creek are Bulgarian (98.4%, a difference of 0.0%), Immigrants from Canada (98.4%, a difference of 0.0%), Slavic (98.4%, a difference of 0.0%), New Zealander (98.4%, a difference of 0.0%), and Immigrants from North America (98.4%, a difference of 0.0%).
| Demographics | Rating | Rank | Kindergarten |
| Celtics | 99.8 /100 | #53 | Exceptional 98.4% |
| Pueblo | 99.8 /100 | #54 | Exceptional 98.4% |
| Immigrants | Scotland | 99.8 /100 | #55 | Exceptional 98.4% |
| Americans | 99.8 /100 | #56 | Exceptional 98.4% |
| Austrians | 99.8 /100 | #57 | Exceptional 98.4% |
| Bulgarians | 99.7 /100 | #58 | Exceptional 98.4% |
| Immigrants | Canada | 99.7 /100 | #59 | Exceptional 98.4% |
| Creek | 99.7 /100 | #60 | Exceptional 98.4% |
| Slavs | 99.7 /100 | #61 | Exceptional 98.4% |
| New Zealanders | 99.7 /100 | #62 | Exceptional 98.4% |
| Immigrants | North America | 99.7 /100 | #63 | Exceptional 98.4% |
| Greeks | 99.7 /100 | #64 | Exceptional 98.4% |
| Maltese | 99.7 /100 | #65 | Exceptional 98.4% |
| Cheyenne | 99.6 /100 | #66 | Exceptional 98.4% |
| Canadians | 99.6 /100 | #67 | Exceptional 98.4% |
Demographics Similar to French Canadians by Kindergarten
In terms of kindergarten, the demographic groups most similar to French Canadians are Czech (98.6%, a difference of 0.0%), Scandinavian (98.6%, a difference of 0.0%), French (98.6%, a difference of 0.010%), European (98.6%, a difference of 0.010%), and Croatian (98.6%, a difference of 0.020%).
| Demographics | Rating | Rank | Kindergarten |
| Sioux | 100.0 /100 | #25 | Exceptional 98.6% |
| Poles | 100.0 /100 | #26 | Exceptional 98.6% |
| Scotch-Irish | 100.0 /100 | #27 | Exceptional 98.6% |
| Croatians | 100.0 /100 | #28 | Exceptional 98.6% |
| French | 100.0 /100 | #29 | Exceptional 98.6% |
| Europeans | 100.0 /100 | #30 | Exceptional 98.6% |
| Czechs | 100.0 /100 | #31 | Exceptional 98.6% |
| French Canadians | 100.0 /100 | #32 | Exceptional 98.6% |
| Scandinavians | 100.0 /100 | #33 | Exceptional 98.6% |
| Chinese | 100.0 /100 | #34 | Exceptional 98.5% |
| Swiss | 100.0 /100 | #35 | Exceptional 98.5% |
| British | 99.9 /100 | #36 | Exceptional 98.5% |
| Italians | 99.9 /100 | #37 | Exceptional 98.5% |
| Latvians | 99.9 /100 | #38 | Exceptional 98.5% |
| Chippewa | 99.9 /100 | #39 | Exceptional 98.5% |