Creek vs Immigrants from Ukraine 11th Grade
COMPARE
Creek
Immigrants from Ukraine
11th Grade
11th Grade Comparison
Creek
Immigrants from Ukraine
92.4%
11TH GRADE
40.9/ 100
METRIC RATING
179th/ 347
METRIC RANK
93.0%
11TH GRADE
89.8/ 100
METRIC RATING
129th/ 347
METRIC RANK
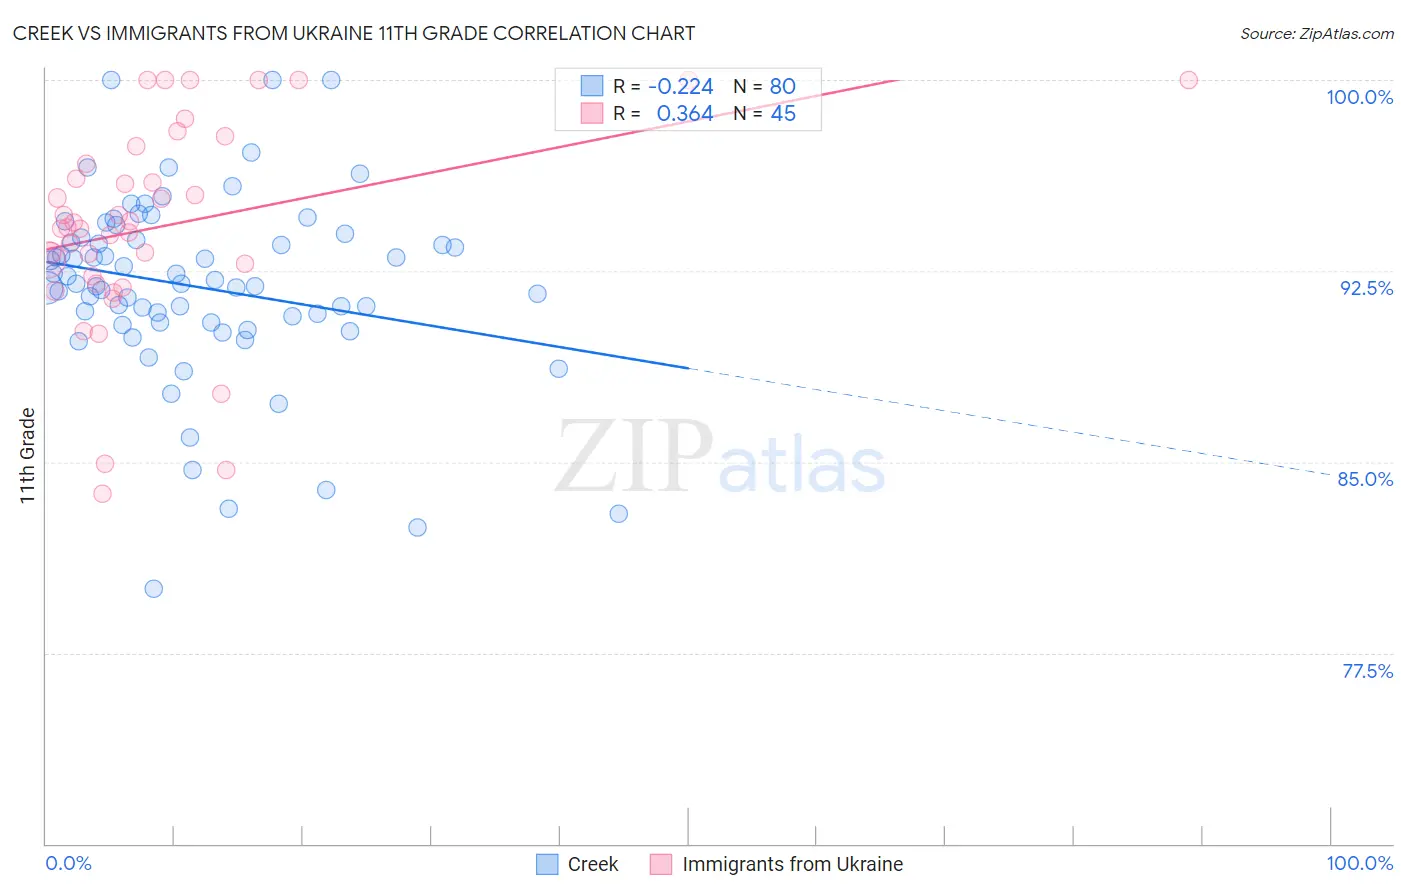
Creek vs Immigrants from Ukraine 11th Grade Correlation Chart
The statistical analysis conducted on geographies consisting of 178,480,629 people shows a weak negative correlation between the proportion of Creek and percentage of population with at least 11th grade education in the United States with a correlation coefficient (R) of -0.224 and weighted average of 92.4%. Similarly, the statistical analysis conducted on geographies consisting of 289,714,613 people shows a mild positive correlation between the proportion of Immigrants from Ukraine and percentage of population with at least 11th grade education in the United States with a correlation coefficient (R) of 0.364 and weighted average of 93.0%, a difference of 0.62%.
11th Grade Correlation Summary
| Measurement | Creek | Immigrants from Ukraine |
| Minimum | 80.0% | 83.8% |
| Maximum | 100.0% | 100.0% |
| Range | 20.0% | 16.2% |
| Mean | 91.9% | 94.3% |
| Median | 92.0% | 94.2% |
| Interquartile 25% (IQ1) | 90.5% | 92.1% |
| Interquartile 75% (IQ3) | 93.8% | 97.1% |
| Interquartile Range (IQR) | 3.3% | 4.9% |
| Standard Deviation (Sample) | 3.7% | 4.0% |
| Standard Deviation (Population) | 3.7% | 4.0% |
Similar Demographics by 11th Grade
Demographics Similar to Creek by 11th Grade
In terms of 11th grade, the demographic groups most similar to Creek are Inupiat (92.4%, a difference of 0.0%), Cherokee (92.4%, a difference of 0.0%), Sudanese (92.5%, a difference of 0.020%), Immigrants from Morocco (92.4%, a difference of 0.020%), and Immigrants from Malaysia (92.4%, a difference of 0.030%).
| Demographics | Rating | Rank | 11th Grade |
| Immigrants | Pakistan | 52.3 /100 | #172 | Average 92.5% |
| Indians (Asian) | 51.5 /100 | #173 | Average 92.5% |
| Asians | 50.0 /100 | #174 | Average 92.5% |
| Shoshone | 48.9 /100 | #175 | Average 92.5% |
| Spaniards | 46.9 /100 | #176 | Average 92.5% |
| Guamanians/Chamorros | 45.0 /100 | #177 | Average 92.5% |
| Sudanese | 43.4 /100 | #178 | Average 92.5% |
| Creek | 40.9 /100 | #179 | Average 92.4% |
| Inupiat | 40.7 /100 | #180 | Average 92.4% |
| Cherokee | 40.7 /100 | #181 | Average 92.4% |
| Immigrants | Morocco | 38.6 /100 | #182 | Fair 92.4% |
| Immigrants | Malaysia | 37.6 /100 | #183 | Fair 92.4% |
| Immigrants | Asia | 37.4 /100 | #184 | Fair 92.4% |
| Immigrants | Nepal | 36.4 /100 | #185 | Fair 92.4% |
| Arapaho | 35.1 /100 | #186 | Fair 92.4% |
Demographics Similar to Immigrants from Ukraine by 11th Grade
In terms of 11th grade, the demographic groups most similar to Immigrants from Ukraine are Albanian (93.0%, a difference of 0.010%), Egyptian (93.0%, a difference of 0.010%), Immigrants from Bosnia and Herzegovina (93.0%, a difference of 0.020%), Mongolian (93.0%, a difference of 0.050%), and Delaware (93.0%, a difference of 0.060%).
| Demographics | Rating | Rank | 11th Grade |
| Immigrants | Belarus | 96.3 /100 | #122 | Exceptional 93.3% |
| Immigrants | Greece | 95.9 /100 | #123 | Exceptional 93.2% |
| Immigrants | Eastern Europe | 95.9 /100 | #124 | Exceptional 93.2% |
| Immigrants | Sri Lanka | 95.6 /100 | #125 | Exceptional 93.2% |
| Basques | 95.2 /100 | #126 | Exceptional 93.2% |
| Immigrants | Kazakhstan | 92.4 /100 | #127 | Exceptional 93.1% |
| Immigrants | Jordan | 92.4 /100 | #128 | Exceptional 93.1% |
| Immigrants | Ukraine | 89.8 /100 | #129 | Excellent 93.0% |
| Albanians | 89.5 /100 | #130 | Excellent 93.0% |
| Egyptians | 89.5 /100 | #131 | Excellent 93.0% |
| Immigrants | Bosnia and Herzegovina | 89.0 /100 | #132 | Excellent 93.0% |
| Mongolians | 87.6 /100 | #133 | Excellent 93.0% |
| Delaware | 87.3 /100 | #134 | Excellent 93.0% |
| Immigrants | Italy | 86.6 /100 | #135 | Excellent 92.9% |
| Cree | 85.9 /100 | #136 | Excellent 92.9% |