Creek vs Pakistani 11th Grade
COMPARE
Creek
Pakistani
11th Grade
11th Grade Comparison
Creek
Pakistanis
92.4%
11TH GRADE
40.9/ 100
METRIC RATING
179th/ 347
METRIC RANK
92.8%
11TH GRADE
79.6/ 100
METRIC RATING
145th/ 347
METRIC RANK
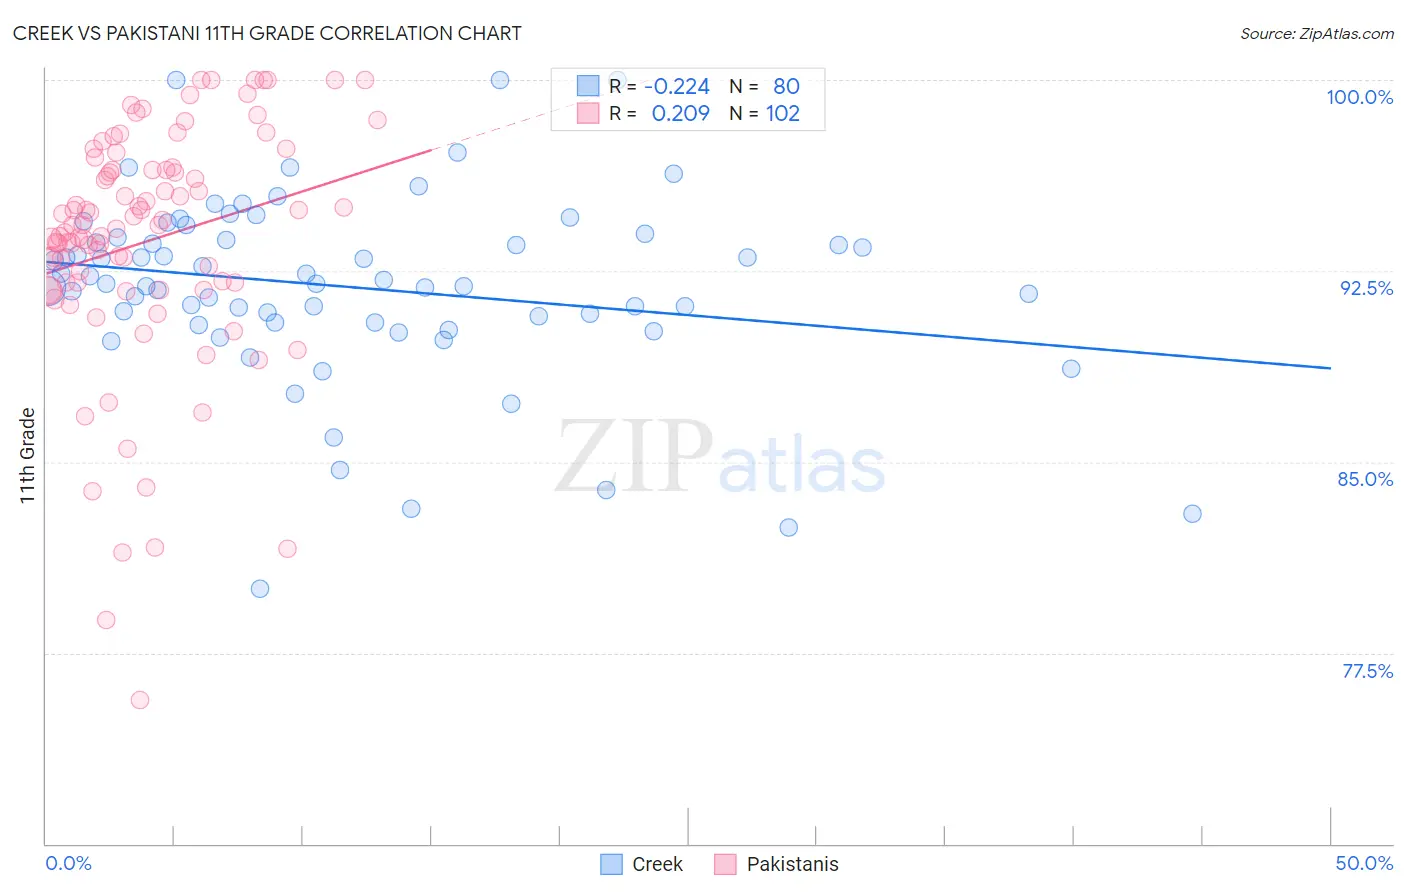
Creek vs Pakistani 11th Grade Correlation Chart
The statistical analysis conducted on geographies consisting of 178,480,629 people shows a weak negative correlation between the proportion of Creek and percentage of population with at least 11th grade education in the United States with a correlation coefficient (R) of -0.224 and weighted average of 92.4%. Similarly, the statistical analysis conducted on geographies consisting of 335,356,437 people shows a weak positive correlation between the proportion of Pakistanis and percentage of population with at least 11th grade education in the United States with a correlation coefficient (R) of 0.209 and weighted average of 92.8%, a difference of 0.43%.
11th Grade Correlation Summary
| Measurement | Creek | Pakistani |
| Minimum | 80.0% | 75.6% |
| Maximum | 100.0% | 100.0% |
| Range | 20.0% | 24.4% |
| Mean | 91.9% | 93.7% |
| Median | 92.0% | 94.3% |
| Interquartile 25% (IQ1) | 90.5% | 92.0% |
| Interquartile 75% (IQ3) | 93.8% | 96.5% |
| Interquartile Range (IQR) | 3.3% | 4.4% |
| Standard Deviation (Sample) | 3.7% | 4.7% |
| Standard Deviation (Population) | 3.7% | 4.7% |
Similar Demographics by 11th Grade
Demographics Similar to Creek by 11th Grade
In terms of 11th grade, the demographic groups most similar to Creek are Inupiat (92.4%, a difference of 0.0%), Cherokee (92.4%, a difference of 0.0%), Sudanese (92.5%, a difference of 0.020%), Immigrants from Morocco (92.4%, a difference of 0.020%), and Immigrants from Malaysia (92.4%, a difference of 0.030%).
| Demographics | Rating | Rank | 11th Grade |
| Immigrants | Pakistan | 52.3 /100 | #172 | Average 92.5% |
| Indians (Asian) | 51.5 /100 | #173 | Average 92.5% |
| Asians | 50.0 /100 | #174 | Average 92.5% |
| Shoshone | 48.9 /100 | #175 | Average 92.5% |
| Spaniards | 46.9 /100 | #176 | Average 92.5% |
| Guamanians/Chamorros | 45.0 /100 | #177 | Average 92.5% |
| Sudanese | 43.4 /100 | #178 | Average 92.5% |
| Creek | 40.9 /100 | #179 | Average 92.4% |
| Inupiat | 40.7 /100 | #180 | Average 92.4% |
| Cherokee | 40.7 /100 | #181 | Average 92.4% |
| Immigrants | Morocco | 38.6 /100 | #182 | Fair 92.4% |
| Immigrants | Malaysia | 37.6 /100 | #183 | Fair 92.4% |
| Immigrants | Asia | 37.4 /100 | #184 | Fair 92.4% |
| Immigrants | Nepal | 36.4 /100 | #185 | Fair 92.4% |
| Arapaho | 35.1 /100 | #186 | Fair 92.4% |
Demographics Similar to Pakistanis by 11th Grade
In terms of 11th grade, the demographic groups most similar to Pakistanis are Assyrian/Chaldean/Syriac (92.8%, a difference of 0.010%), Iroquois (92.8%, a difference of 0.010%), Immigrants from Kenya (92.8%, a difference of 0.010%), Hmong (92.8%, a difference of 0.020%), and Immigrants from Poland (92.8%, a difference of 0.020%).
| Demographics | Rating | Rank | 11th Grade |
| Immigrants | Brazil | 85.1 /100 | #138 | Excellent 92.9% |
| Crow | 84.1 /100 | #139 | Excellent 92.9% |
| Venezuelans | 83.4 /100 | #140 | Excellent 92.9% |
| Chileans | 83.0 /100 | #141 | Excellent 92.9% |
| Kenyans | 82.0 /100 | #142 | Excellent 92.9% |
| Ugandans | 81.4 /100 | #143 | Excellent 92.9% |
| Assyrians/Chaldeans/Syriacs | 80.5 /100 | #144 | Excellent 92.8% |
| Pakistanis | 79.6 /100 | #145 | Good 92.8% |
| Iroquois | 79.1 /100 | #146 | Good 92.8% |
| Immigrants | Kenya | 78.7 /100 | #147 | Good 92.8% |
| Hmong | 78.6 /100 | #148 | Good 92.8% |
| Immigrants | Poland | 78.5 /100 | #149 | Good 92.8% |
| Immigrants | Egypt | 77.5 /100 | #150 | Good 92.8% |
| Potawatomi | 74.3 /100 | #151 | Good 92.8% |
| Iraqis | 74.2 /100 | #152 | Good 92.8% |