Cree vs Yuman 2nd Grade
COMPARE
Cree
Yuman
2nd Grade
2nd Grade Comparison
Cree
Yuman
98.2%
2ND GRADE
98.0/ 100
METRIC RATING
102nd/ 347
METRIC RANK
97.8%
2ND GRADE
20.0/ 100
METRIC RATING
203rd/ 347
METRIC RANK
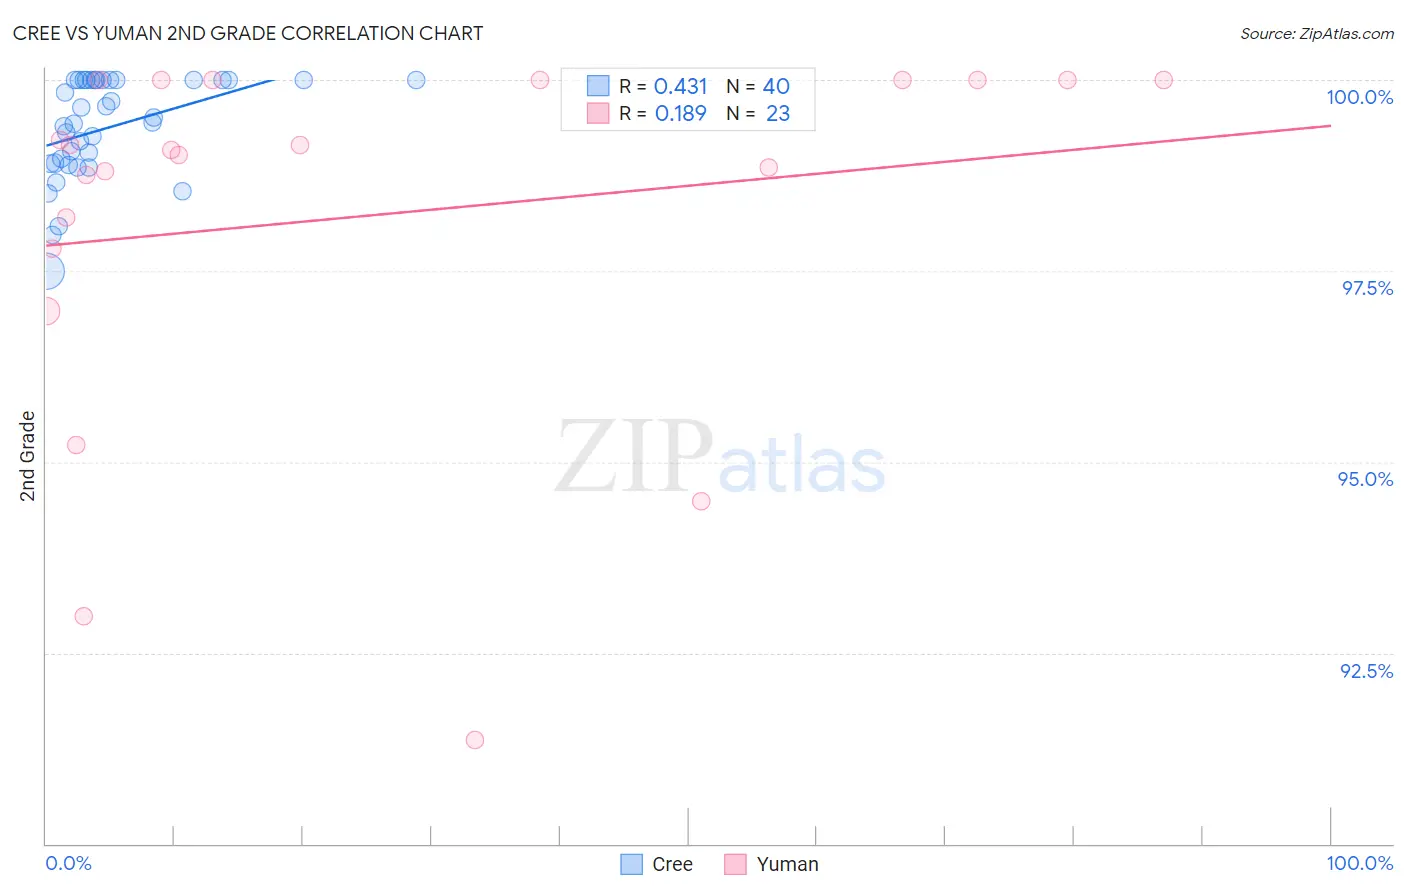
Cree vs Yuman 2nd Grade Correlation Chart
The statistical analysis conducted on geographies consisting of 76,204,399 people shows a moderate positive correlation between the proportion of Cree and percentage of population with at least 2nd grade education in the United States with a correlation coefficient (R) of 0.431 and weighted average of 98.2%. Similarly, the statistical analysis conducted on geographies consisting of 40,696,349 people shows a poor positive correlation between the proportion of Yuman and percentage of population with at least 2nd grade education in the United States with a correlation coefficient (R) of 0.189 and weighted average of 97.8%, a difference of 0.42%.
2nd Grade Correlation Summary
| Measurement | Cree | Yuman |
| Minimum | 97.5% | 91.4% |
| Maximum | 100.0% | 100.0% |
| Range | 2.5% | 8.6% |
| Mean | 99.4% | 98.2% |
| Median | 99.5% | 99.1% |
| Interquartile 25% (IQ1) | 98.9% | 97.8% |
| Interquartile 75% (IQ3) | 100.0% | 100.0% |
| Interquartile Range (IQR) | 1.1% | 2.2% |
| Standard Deviation (Sample) | 0.66% | 2.4% |
| Standard Deviation (Population) | 0.65% | 2.4% |
Similar Demographics by 2nd Grade
Demographics Similar to Cree by 2nd Grade
In terms of 2nd grade, the demographic groups most similar to Cree are Immigrants from Ireland (98.2%, a difference of 0.0%), Romanian (98.2%, a difference of 0.0%), Puget Sound Salish (98.2%, a difference of 0.0%), Choctaw (98.2%, a difference of 0.010%), and Nonimmigrants (98.2%, a difference of 0.010%).
| Demographics | Rating | Rank | 2nd Grade |
| South Africans | 98.6 /100 | #95 | Exceptional 98.2% |
| Cypriots | 98.4 /100 | #96 | Exceptional 98.2% |
| Choctaw | 98.3 /100 | #97 | Exceptional 98.2% |
| Immigrants | Nonimmigrants | 98.3 /100 | #98 | Exceptional 98.2% |
| Immigrants | Ireland | 98.0 /100 | #99 | Exceptional 98.2% |
| Romanians | 98.0 /100 | #100 | Exceptional 98.2% |
| Puget Sound Salish | 98.0 /100 | #101 | Exceptional 98.2% |
| Cree | 98.0 /100 | #102 | Exceptional 98.2% |
| Pima | 97.6 /100 | #103 | Exceptional 98.2% |
| Turks | 97.6 /100 | #104 | Exceptional 98.2% |
| Yugoslavians | 97.5 /100 | #105 | Exceptional 98.2% |
| Bhutanese | 97.5 /100 | #106 | Exceptional 98.1% |
| German Russians | 97.4 /100 | #107 | Exceptional 98.1% |
| Immigrants | Switzerland | 97.3 /100 | #108 | Exceptional 98.1% |
| Basques | 97.2 /100 | #109 | Exceptional 98.1% |
Demographics Similar to Yuman by 2nd Grade
In terms of 2nd grade, the demographic groups most similar to Yuman are Immigrants from Lebanon (97.8%, a difference of 0.0%), Tohono O'odham (97.8%, a difference of 0.0%), Immigrants from Ukraine (97.8%, a difference of 0.0%), Immigrants from Albania (97.8%, a difference of 0.010%), and Immigrants from Southern Europe (97.8%, a difference of 0.010%).
| Demographics | Rating | Rank | 2nd Grade |
| Immigrants | Kenya | 26.4 /100 | #196 | Fair 97.8% |
| Immigrants | Uganda | 26.3 /100 | #197 | Fair 97.8% |
| Guamanians/Chamorros | 25.7 /100 | #198 | Fair 97.8% |
| Immigrants | Egypt | 24.4 /100 | #199 | Fair 97.8% |
| Immigrants | Lebanon | 20.9 /100 | #200 | Fair 97.8% |
| Tohono O'odham | 20.9 /100 | #201 | Fair 97.8% |
| Immigrants | Ukraine | 20.5 /100 | #202 | Fair 97.8% |
| Yuman | 20.0 /100 | #203 | Fair 97.8% |
| Immigrants | Albania | 18.4 /100 | #204 | Poor 97.8% |
| Immigrants | Southern Europe | 18.1 /100 | #205 | Poor 97.8% |
| Immigrants | Chile | 17.3 /100 | #206 | Poor 97.7% |
| Africans | 15.6 /100 | #207 | Poor 97.7% |
| Immigrants | Northern Africa | 12.3 /100 | #208 | Poor 97.7% |
| Immigrants | Oceania | 10.9 /100 | #209 | Poor 97.7% |
| Costa Ricans | 10.5 /100 | #210 | Poor 97.7% |