Costa Rican vs Mongolian No Schooling Completed
COMPARE
Costa Rican
Mongolian
No Schooling Completed
No Schooling Completed Comparison
Costa Ricans
Mongolians
2.2%
NO SCHOOLING COMPLETED
17.1/ 100
METRIC RATING
201st/ 347
METRIC RANK
2.1%
NO SCHOOLING COMPLETED
40.8/ 100
METRIC RATING
185th/ 347
METRIC RANK
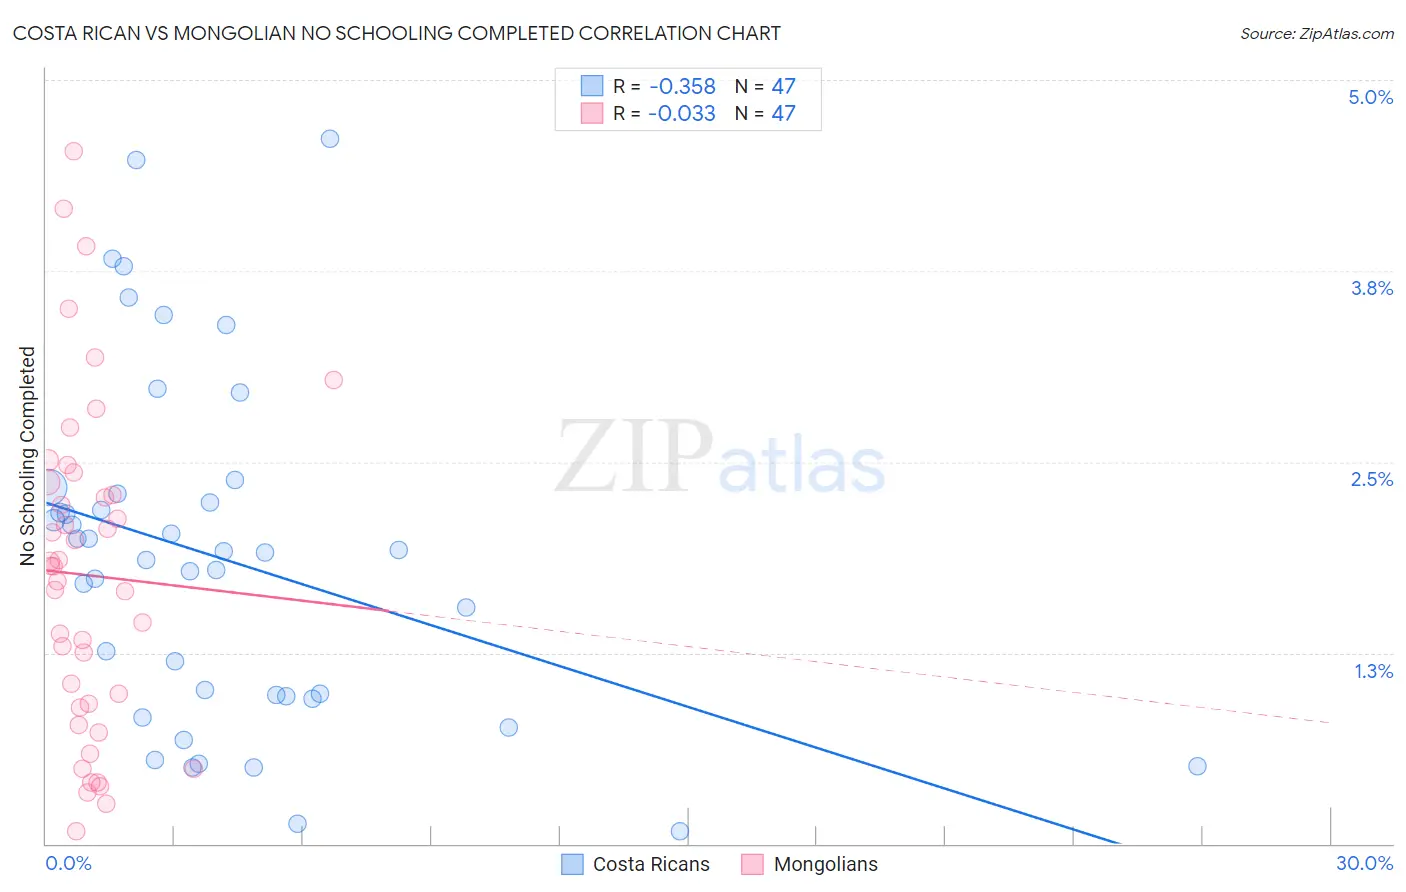
Costa Rican vs Mongolian No Schooling Completed Correlation Chart
The statistical analysis conducted on geographies consisting of 252,541,850 people shows a mild negative correlation between the proportion of Costa Ricans and percentage of population with no schooling in the United States with a correlation coefficient (R) of -0.358 and weighted average of 2.2%. Similarly, the statistical analysis conducted on geographies consisting of 139,824,247 people shows no correlation between the proportion of Mongolians and percentage of population with no schooling in the United States with a correlation coefficient (R) of -0.033 and weighted average of 2.1%, a difference of 4.0%.
No Schooling Completed Correlation Summary
| Measurement | Costa Rican | Mongolian |
| Minimum | 0.080% | 0.080% |
| Maximum | 4.6% | 4.5% |
| Range | 4.5% | 4.5% |
| Mean | 1.9% | 1.8% |
| Median | 1.9% | 1.8% |
| Interquartile 25% (IQ1) | 0.97% | 0.89% |
| Interquartile 75% (IQ3) | 2.3% | 2.4% |
| Interquartile Range (IQR) | 1.3% | 1.5% |
| Standard Deviation (Sample) | 1.1% | 1.1% |
| Standard Deviation (Population) | 1.1% | 1.1% |
Demographics Similar to Costa Ricans and Mongolians by No Schooling Completed
In terms of no schooling completed, the demographic groups most similar to Costa Ricans are Immigrants from Northern Africa (2.2%, a difference of 0.52%), Moroccan (2.2%, a difference of 0.82%), Laotian (2.2%, a difference of 0.93%), African (2.2%, a difference of 0.98%), and Immigrants from Chile (2.2%, a difference of 1.2%). Similarly, the demographic groups most similar to Mongolians are Pima (2.1%, a difference of 0.070%), Black/African American (2.1%, a difference of 0.090%), Immigrants from Bosnia and Herzegovina (2.1%, a difference of 0.30%), Navajo (2.1%, a difference of 0.60%), and Immigrants from Kenya (2.1%, a difference of 0.65%).
| Demographics | Rating | Rank | No Schooling Completed |
| Blacks/African Americans | 41.4 /100 | #183 | Average 2.1% |
| Pima | 41.3 /100 | #184 | Average 2.1% |
| Mongolians | 40.8 /100 | #185 | Average 2.1% |
| Immigrants | Bosnia and Herzegovina | 38.6 /100 | #186 | Fair 2.1% |
| Navajo | 36.5 /100 | #187 | Fair 2.1% |
| Immigrants | Kenya | 36.2 /100 | #188 | Fair 2.1% |
| Immigrants | Egypt | 36.1 /100 | #189 | Fair 2.1% |
| Spanish Americans | 32.6 /100 | #190 | Fair 2.1% |
| Bermudans | 30.7 /100 | #191 | Fair 2.1% |
| Guamanians/Chamorros | 29.8 /100 | #192 | Fair 2.2% |
| Paraguayans | 29.3 /100 | #193 | Fair 2.2% |
| Immigrants | Albania | 28.3 /100 | #194 | Fair 2.2% |
| Hawaiians | 27.0 /100 | #195 | Fair 2.2% |
| Immigrants | Ukraine | 26.1 /100 | #196 | Fair 2.2% |
| Immigrants | Southern Europe | 23.8 /100 | #197 | Fair 2.2% |
| Immigrants | Chile | 22.7 /100 | #198 | Fair 2.2% |
| Africans | 21.8 /100 | #199 | Fair 2.2% |
| Immigrants | Northern Africa | 19.5 /100 | #200 | Poor 2.2% |
| Costa Ricans | 17.1 /100 | #201 | Poor 2.2% |
| Moroccans | 13.7 /100 | #202 | Poor 2.2% |
| Laotians | 13.3 /100 | #203 | Poor 2.2% |