Costa Rican vs Ottawa No Schooling Completed
COMPARE
Costa Rican
Ottawa
No Schooling Completed
No Schooling Completed Comparison
Costa Ricans
Ottawa
2.2%
NO SCHOOLING COMPLETED
17.1/ 100
METRIC RATING
201st/ 347
METRIC RANK
1.6%
NO SCHOOLING COMPLETED
99.9/ 100
METRIC RATING
47th/ 347
METRIC RANK
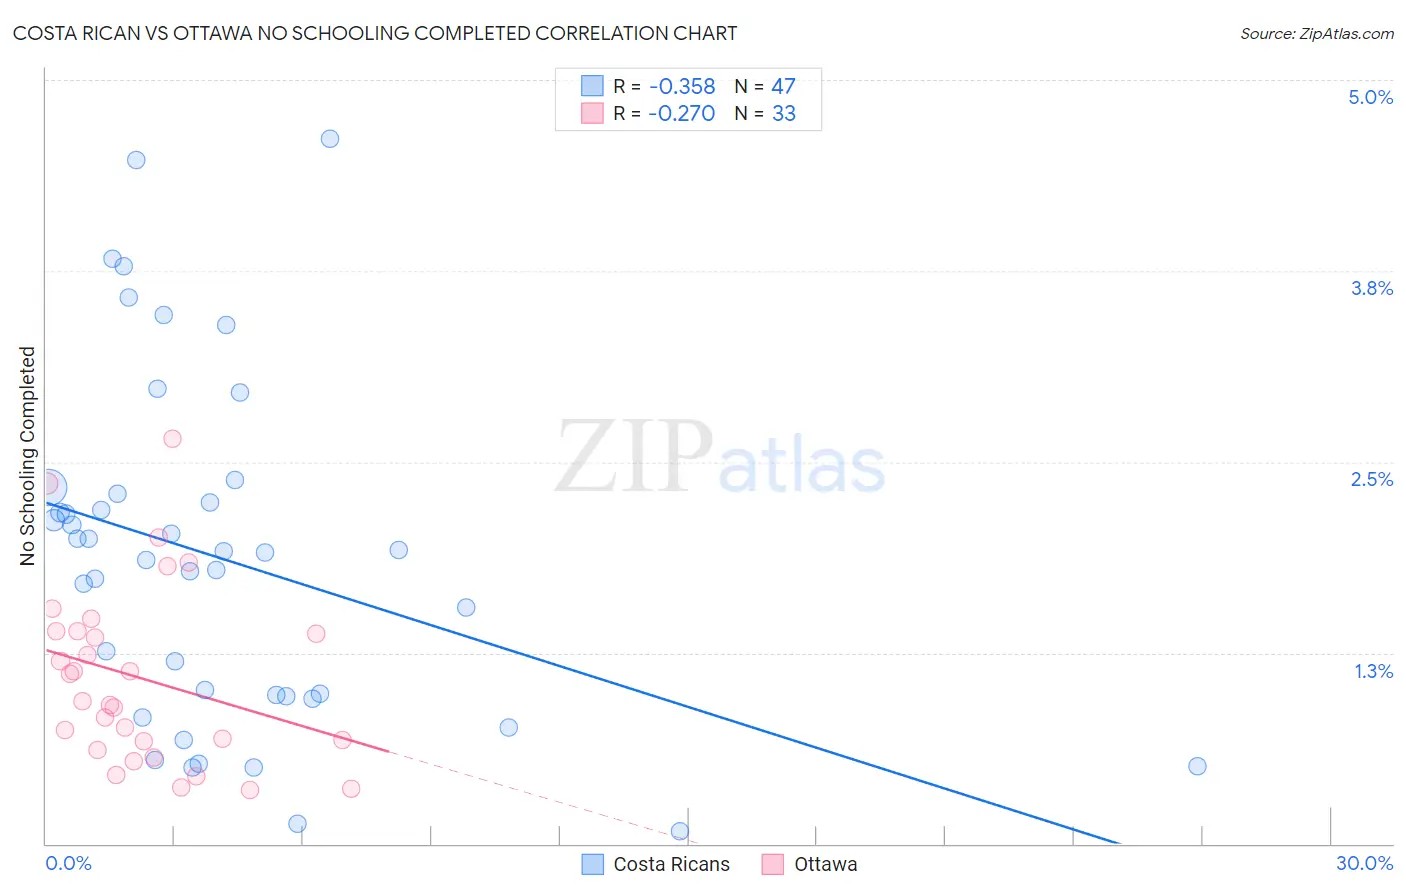
Costa Rican vs Ottawa No Schooling Completed Correlation Chart
The statistical analysis conducted on geographies consisting of 252,541,850 people shows a mild negative correlation between the proportion of Costa Ricans and percentage of population with no schooling in the United States with a correlation coefficient (R) of -0.358 and weighted average of 2.2%. Similarly, the statistical analysis conducted on geographies consisting of 49,739,017 people shows a weak negative correlation between the proportion of Ottawa and percentage of population with no schooling in the United States with a correlation coefficient (R) of -0.270 and weighted average of 1.6%, a difference of 35.5%.
No Schooling Completed Correlation Summary
| Measurement | Costa Rican | Ottawa |
| Minimum | 0.080% | 0.35% |
| Maximum | 4.6% | 2.6% |
| Range | 4.5% | 2.3% |
| Mean | 1.9% | 1.1% |
| Median | 1.9% | 0.93% |
| Interquartile 25% (IQ1) | 0.97% | 0.64% |
| Interquartile 75% (IQ3) | 2.3% | 1.4% |
| Interquartile Range (IQR) | 1.3% | 0.75% |
| Standard Deviation (Sample) | 1.1% | 0.58% |
| Standard Deviation (Population) | 1.1% | 0.57% |
Similar Demographics by No Schooling Completed
Demographics Similar to Costa Ricans by No Schooling Completed
In terms of no schooling completed, the demographic groups most similar to Costa Ricans are Immigrants from Northern Africa (2.2%, a difference of 0.52%), Moroccan (2.2%, a difference of 0.82%), Laotian (2.2%, a difference of 0.93%), African (2.2%, a difference of 0.98%), and Hopi (2.2%, a difference of 1.0%).
| Demographics | Rating | Rank | No Schooling Completed |
| Immigrants | Albania | 28.3 /100 | #194 | Fair 2.2% |
| Hawaiians | 27.0 /100 | #195 | Fair 2.2% |
| Immigrants | Ukraine | 26.1 /100 | #196 | Fair 2.2% |
| Immigrants | Southern Europe | 23.8 /100 | #197 | Fair 2.2% |
| Immigrants | Chile | 22.7 /100 | #198 | Fair 2.2% |
| Africans | 21.8 /100 | #199 | Fair 2.2% |
| Immigrants | Northern Africa | 19.5 /100 | #200 | Poor 2.2% |
| Costa Ricans | 17.1 /100 | #201 | Poor 2.2% |
| Moroccans | 13.7 /100 | #202 | Poor 2.2% |
| Laotians | 13.3 /100 | #203 | Poor 2.2% |
| Hopi | 12.9 /100 | #204 | Poor 2.2% |
| Immigrants | Bahamas | 11.6 /100 | #205 | Poor 2.2% |
| Bahamians | 11.6 /100 | #206 | Poor 2.2% |
| South American Indians | 11.0 /100 | #207 | Poor 2.2% |
| Uruguayans | 11.0 /100 | #208 | Poor 2.2% |
Demographics Similar to Ottawa by No Schooling Completed
In terms of no schooling completed, the demographic groups most similar to Ottawa are Maltese (1.6%, a difference of 0.14%), Czechoslovakian (1.6%, a difference of 0.24%), Immigrants from Scotland (1.6%, a difference of 0.26%), Estonian (1.6%, a difference of 0.27%), and White/Caucasian (1.6%, a difference of 0.31%).
| Demographics | Rating | Rank | No Schooling Completed |
| Luxembourgers | 99.9 /100 | #40 | Exceptional 1.6% |
| Hungarians | 99.9 /100 | #41 | Exceptional 1.6% |
| Bulgarians | 99.9 /100 | #42 | Exceptional 1.6% |
| Australians | 99.9 /100 | #43 | Exceptional 1.6% |
| Estonians | 99.9 /100 | #44 | Exceptional 1.6% |
| Czechoslovakians | 99.9 /100 | #45 | Exceptional 1.6% |
| Maltese | 99.9 /100 | #46 | Exceptional 1.6% |
| Ottawa | 99.9 /100 | #47 | Exceptional 1.6% |
| Immigrants | Scotland | 99.9 /100 | #48 | Exceptional 1.6% |
| Whites/Caucasians | 99.9 /100 | #49 | Exceptional 1.6% |
| Celtics | 99.9 /100 | #50 | Exceptional 1.6% |
| Chippewa | 99.8 /100 | #51 | Exceptional 1.6% |
| Immigrants | Canada | 99.8 /100 | #52 | Exceptional 1.6% |
| Creek | 99.8 /100 | #53 | Exceptional 1.6% |
| Crow | 99.8 /100 | #54 | Exceptional 1.6% |