Costa Rican vs Immigrants from Egypt 9th Grade
COMPARE
Costa Rican
Immigrants from Egypt
9th Grade
9th Grade Comparison
Costa Ricans
Immigrants from Egypt
94.3%
9TH GRADE
3.5/ 100
METRIC RATING
234th/ 347
METRIC RANK
94.9%
9TH GRADE
50.0/ 100
METRIC RATING
174th/ 347
METRIC RANK
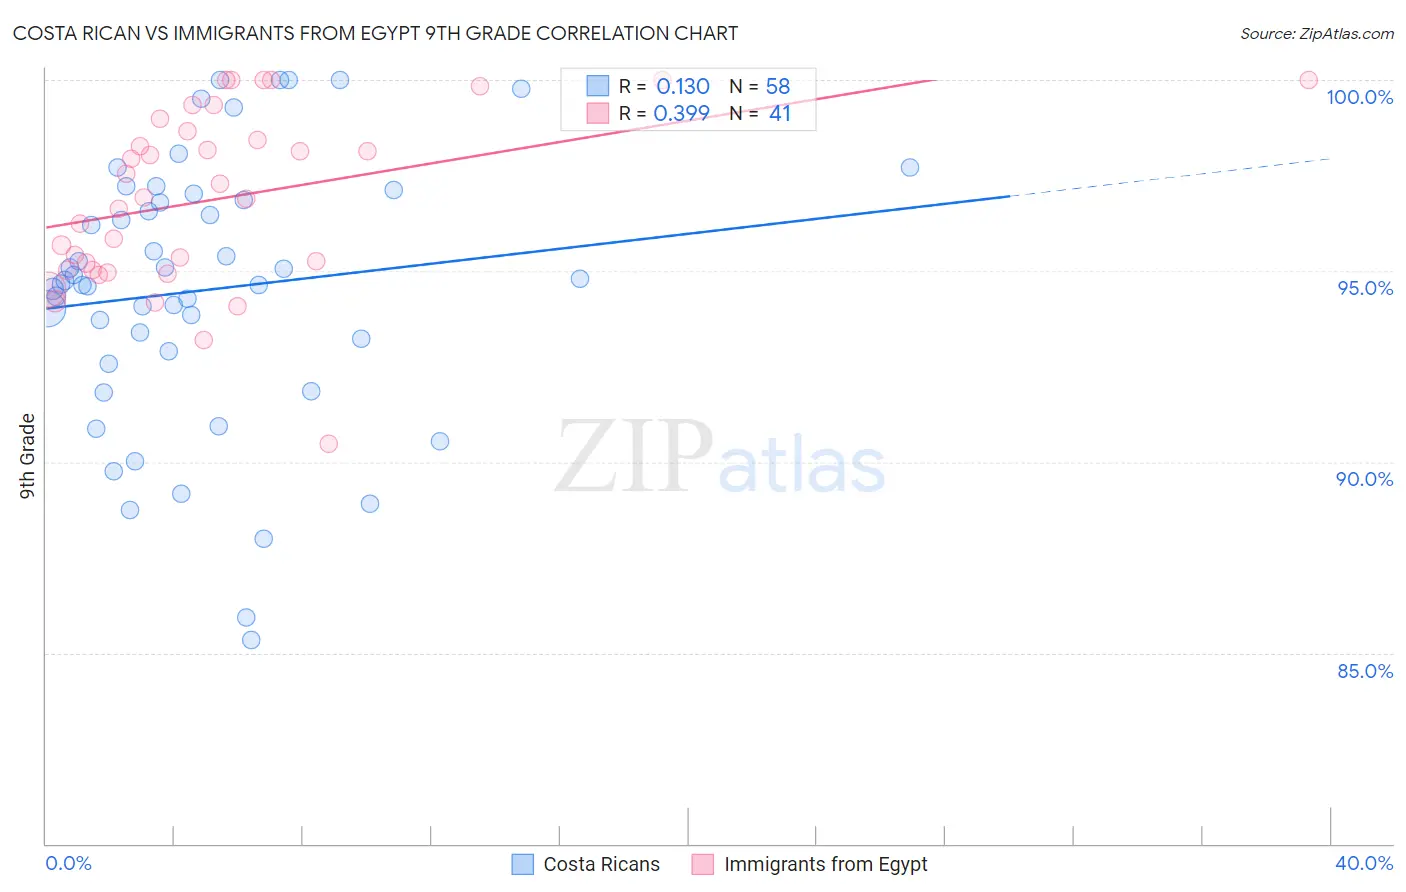
Costa Rican vs Immigrants from Egypt 9th Grade Correlation Chart
The statistical analysis conducted on geographies consisting of 253,601,730 people shows a poor positive correlation between the proportion of Costa Ricans and percentage of population with at least 9th grade education in the United States with a correlation coefficient (R) of 0.130 and weighted average of 94.3%. Similarly, the statistical analysis conducted on geographies consisting of 245,485,794 people shows a mild positive correlation between the proportion of Immigrants from Egypt and percentage of population with at least 9th grade education in the United States with a correlation coefficient (R) of 0.399 and weighted average of 94.9%, a difference of 0.61%.
9th Grade Correlation Summary
| Measurement | Costa Rican | Immigrants from Egypt |
| Minimum | 85.3% | 90.5% |
| Maximum | 100.0% | 100.0% |
| Range | 14.7% | 9.5% |
| Mean | 94.5% | 96.9% |
| Median | 94.7% | 96.9% |
| Interquartile 25% (IQ1) | 92.9% | 95.0% |
| Interquartile 75% (IQ3) | 96.9% | 98.8% |
| Interquartile Range (IQR) | 4.0% | 3.8% |
| Standard Deviation (Sample) | 3.5% | 2.3% |
| Standard Deviation (Population) | 3.4% | 2.3% |
Similar Demographics by 9th Grade
Demographics Similar to Costa Ricans by 9th Grade
In terms of 9th grade, the demographic groups most similar to Costa Ricans are Nigerian (94.3%, a difference of 0.010%), Bolivian (94.3%, a difference of 0.010%), Immigrants from Panama (94.3%, a difference of 0.020%), Immigrants from Africa (94.3%, a difference of 0.020%), and Apache (94.3%, a difference of 0.030%).
| Demographics | Rating | Rank | 9th Grade |
| Immigrants | Sierra Leone | 4.8 /100 | #227 | Tragic 94.4% |
| Lumbee | 4.7 /100 | #228 | Tragic 94.4% |
| Immigrants | Southern Europe | 4.5 /100 | #229 | Tragic 94.3% |
| Apache | 4.2 /100 | #230 | Tragic 94.3% |
| Immigrants | Panama | 4.0 /100 | #231 | Tragic 94.3% |
| Immigrants | Africa | 3.9 /100 | #232 | Tragic 94.3% |
| Nigerians | 3.7 /100 | #233 | Tragic 94.3% |
| Costa Ricans | 3.5 /100 | #234 | Tragic 94.3% |
| Bolivians | 3.3 /100 | #235 | Tragic 94.3% |
| Somalis | 2.9 /100 | #236 | Tragic 94.3% |
| Koreans | 2.9 /100 | #237 | Tragic 94.3% |
| South American Indians | 2.8 /100 | #238 | Tragic 94.3% |
| Immigrants | China | 2.8 /100 | #239 | Tragic 94.3% |
| Immigrants | Ethiopia | 2.7 /100 | #240 | Tragic 94.3% |
| Spanish Americans | 2.6 /100 | #241 | Tragic 94.2% |
Demographics Similar to Immigrants from Egypt by 9th Grade
In terms of 9th grade, the demographic groups most similar to Immigrants from Egypt are Brazilian (94.9%, a difference of 0.0%), Cheyenne (94.9%, a difference of 0.010%), Immigrants from Spain (94.9%, a difference of 0.010%), Immigrants from Iraq (94.9%, a difference of 0.020%), and Immigrants from Poland (94.9%, a difference of 0.020%).
| Demographics | Rating | Rank | 9th Grade |
| Immigrants | Brazil | 61.1 /100 | #167 | Good 95.0% |
| Chileans | 60.7 /100 | #168 | Good 95.0% |
| Spaniards | 59.6 /100 | #169 | Average 94.9% |
| Alsatians | 58.6 /100 | #170 | Average 94.9% |
| Colville | 58.5 /100 | #171 | Average 94.9% |
| Iraqis | 54.0 /100 | #172 | Average 94.9% |
| Cheyenne | 51.5 /100 | #173 | Average 94.9% |
| Immigrants | Egypt | 50.0 /100 | #174 | Average 94.9% |
| Brazilians | 49.8 /100 | #175 | Average 94.9% |
| Immigrants | Spain | 49.1 /100 | #176 | Average 94.9% |
| Immigrants | Iraq | 47.8 /100 | #177 | Average 94.9% |
| Immigrants | Poland | 46.7 /100 | #178 | Average 94.9% |
| Immigrants | Venezuela | 46.5 /100 | #179 | Average 94.9% |
| Immigrants | Uganda | 43.1 /100 | #180 | Average 94.8% |
| Sierra Leoneans | 42.7 /100 | #181 | Average 94.8% |