Inupiat vs Lumbee 11th Grade
COMPARE
Inupiat
Lumbee
11th Grade
11th Grade Comparison
Inupiat
Lumbee
92.4%
11TH GRADE
40.7/ 100
METRIC RATING
180th/ 347
METRIC RANK
88.9%
11TH GRADE
0.0/ 100
METRIC RATING
317th/ 347
METRIC RANK
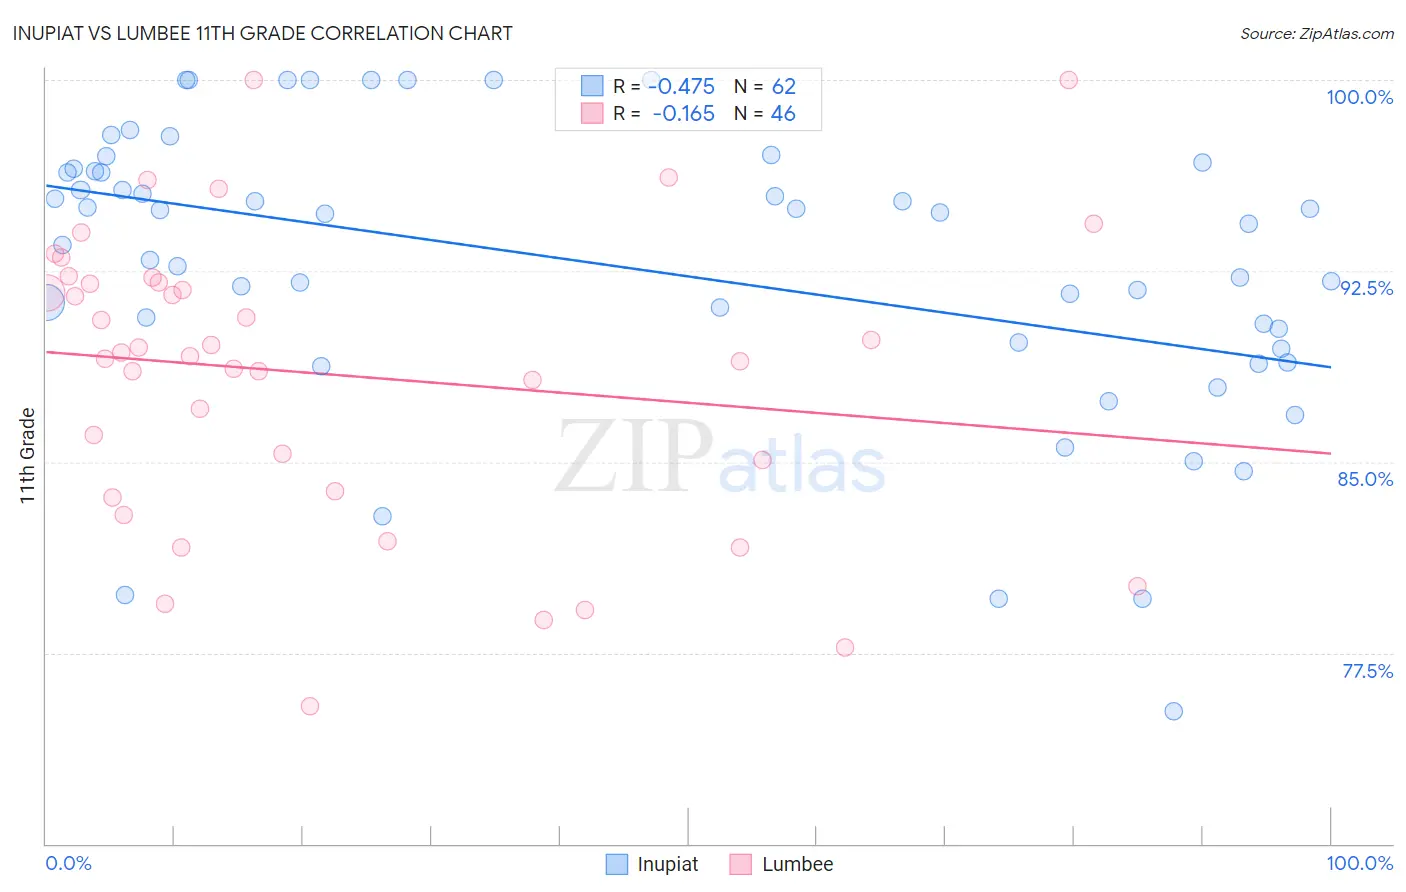
Inupiat vs Lumbee 11th Grade Correlation Chart
The statistical analysis conducted on geographies consisting of 96,349,180 people shows a moderate negative correlation between the proportion of Inupiat and percentage of population with at least 11th grade education in the United States with a correlation coefficient (R) of -0.475 and weighted average of 92.4%. Similarly, the statistical analysis conducted on geographies consisting of 92,299,068 people shows a poor negative correlation between the proportion of Lumbee and percentage of population with at least 11th grade education in the United States with a correlation coefficient (R) of -0.165 and weighted average of 88.9%, a difference of 3.9%.
11th Grade Correlation Summary
| Measurement | Inupiat | Lumbee |
| Minimum | 75.2% | 75.4% |
| Maximum | 100.0% | 100.0% |
| Range | 24.8% | 24.6% |
| Mean | 92.7% | 88.4% |
| Median | 94.5% | 89.2% |
| Interquartile 25% (IQ1) | 89.7% | 83.9% |
| Interquartile 75% (IQ3) | 96.4% | 92.1% |
| Interquartile Range (IQR) | 6.7% | 8.2% |
| Standard Deviation (Sample) | 5.7% | 5.8% |
| Standard Deviation (Population) | 5.6% | 5.7% |
Similar Demographics by 11th Grade
Demographics Similar to Inupiat by 11th Grade
In terms of 11th grade, the demographic groups most similar to Inupiat are Creek (92.4%, a difference of 0.0%), Cherokee (92.4%, a difference of 0.0%), Immigrants from Morocco (92.4%, a difference of 0.020%), Sudanese (92.5%, a difference of 0.030%), and Immigrants from Malaysia (92.4%, a difference of 0.030%).
| Demographics | Rating | Rank | 11th Grade |
| Indians (Asian) | 51.5 /100 | #173 | Average 92.5% |
| Asians | 50.0 /100 | #174 | Average 92.5% |
| Shoshone | 48.9 /100 | #175 | Average 92.5% |
| Spaniards | 46.9 /100 | #176 | Average 92.5% |
| Guamanians/Chamorros | 45.0 /100 | #177 | Average 92.5% |
| Sudanese | 43.4 /100 | #178 | Average 92.5% |
| Creek | 40.9 /100 | #179 | Average 92.4% |
| Inupiat | 40.7 /100 | #180 | Average 92.4% |
| Cherokee | 40.7 /100 | #181 | Average 92.4% |
| Immigrants | Morocco | 38.6 /100 | #182 | Fair 92.4% |
| Immigrants | Malaysia | 37.6 /100 | #183 | Fair 92.4% |
| Immigrants | Asia | 37.4 /100 | #184 | Fair 92.4% |
| Immigrants | Nepal | 36.4 /100 | #185 | Fair 92.4% |
| Arapaho | 35.1 /100 | #186 | Fair 92.4% |
| Immigrants | Western Asia | 35.0 /100 | #187 | Fair 92.4% |
Demographics Similar to Lumbee by 11th Grade
In terms of 11th grade, the demographic groups most similar to Lumbee are Immigrants from Cuba (88.9%, a difference of 0.010%), Nicaraguan (88.9%, a difference of 0.060%), Belizean (88.8%, a difference of 0.15%), Immigrants from Ecuador (89.1%, a difference of 0.16%), and Cape Verdean (89.1%, a difference of 0.17%).
| Demographics | Rating | Rank | 11th Grade |
| Yaqui | 0.0 /100 | #310 | Tragic 89.5% |
| Vietnamese | 0.0 /100 | #311 | Tragic 89.4% |
| Immigrants | Portugal | 0.0 /100 | #312 | Tragic 89.3% |
| Immigrants | Caribbean | 0.0 /100 | #313 | Tragic 89.1% |
| Cape Verdeans | 0.0 /100 | #314 | Tragic 89.1% |
| Immigrants | Ecuador | 0.0 /100 | #315 | Tragic 89.1% |
| Immigrants | Cuba | 0.0 /100 | #316 | Tragic 88.9% |
| Lumbee | 0.0 /100 | #317 | Tragic 88.9% |
| Nicaraguans | 0.0 /100 | #318 | Tragic 88.9% |
| Belizeans | 0.0 /100 | #319 | Tragic 88.8% |
| Immigrants | Armenia | 0.0 /100 | #320 | Tragic 88.8% |
| Immigrants | Belize | 0.0 /100 | #321 | Tragic 88.7% |
| Puerto Ricans | 0.0 /100 | #322 | Tragic 88.4% |
| Pima | 0.0 /100 | #323 | Tragic 88.3% |
| Central American Indians | 0.0 /100 | #324 | Tragic 88.2% |