Immigrants from Peru vs Immigrants from Nigeria 6th Grade
COMPARE
Immigrants from Peru
Immigrants from Nigeria
6th Grade
6th Grade Comparison
Immigrants from Peru
Immigrants from Nigeria
96.2%
6TH GRADE
0.1/ 100
METRIC RATING
279th/ 347
METRIC RANK
96.4%
6TH GRADE
0.3/ 100
METRIC RATING
262nd/ 347
METRIC RANK
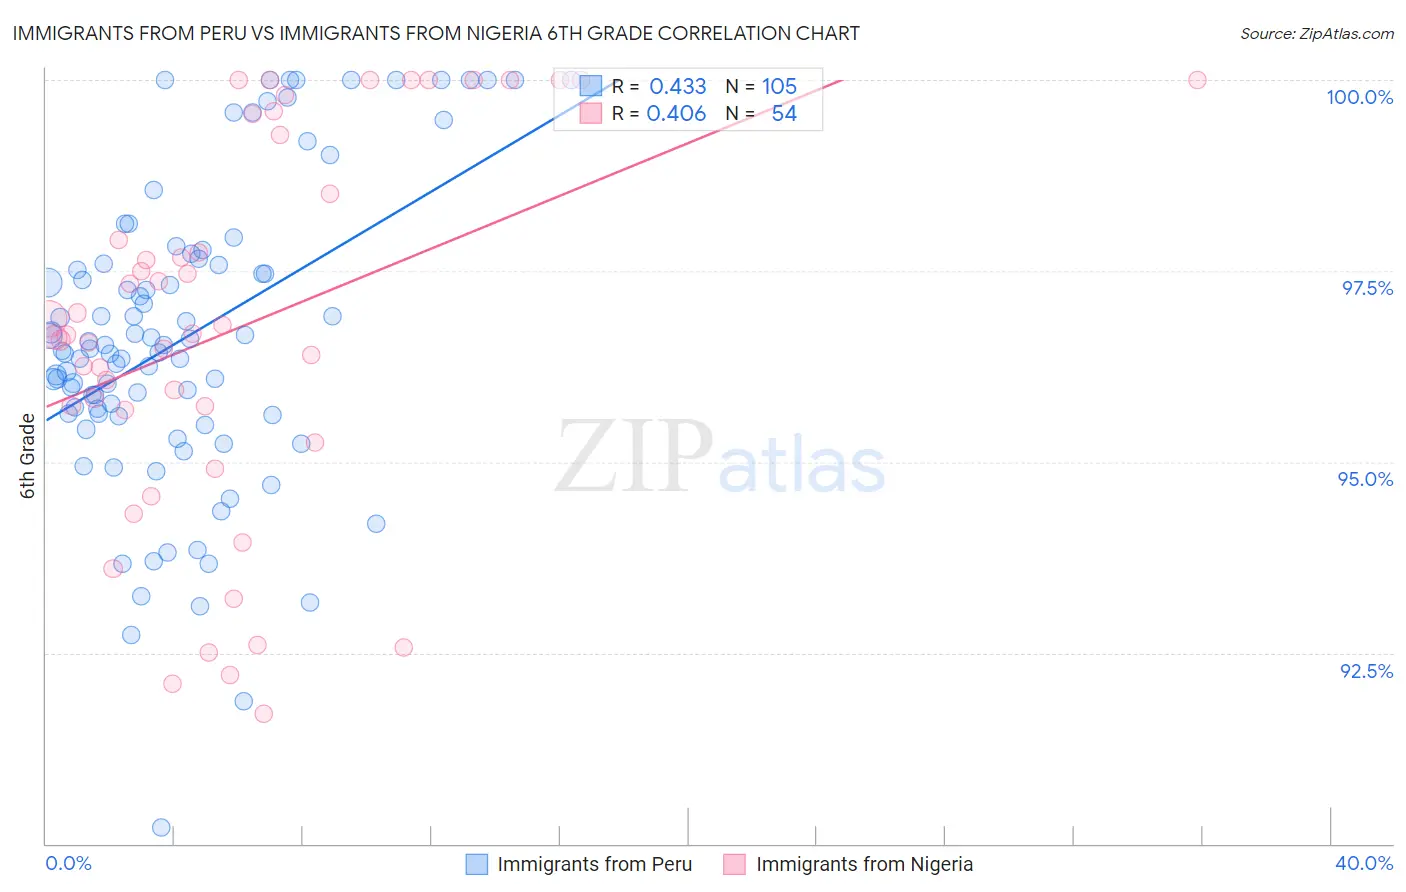
Immigrants from Peru vs Immigrants from Nigeria 6th Grade Correlation Chart
The statistical analysis conducted on geographies consisting of 328,685,754 people shows a moderate positive correlation between the proportion of Immigrants from Peru and percentage of population with at least 6th grade education in the United States with a correlation coefficient (R) of 0.433 and weighted average of 96.2%. Similarly, the statistical analysis conducted on geographies consisting of 283,430,369 people shows a moderate positive correlation between the proportion of Immigrants from Nigeria and percentage of population with at least 6th grade education in the United States with a correlation coefficient (R) of 0.406 and weighted average of 96.4%, a difference of 0.16%.
6th Grade Correlation Summary
| Measurement | Immigrants from Peru | Immigrants from Nigeria |
| Minimum | 90.2% | 91.7% |
| Maximum | 100.0% | 100.0% |
| Range | 9.8% | 8.3% |
| Mean | 96.6% | 96.8% |
| Median | 96.5% | 96.7% |
| Interquartile 25% (IQ1) | 95.6% | 95.7% |
| Interquartile 75% (IQ3) | 97.6% | 99.3% |
| Interquartile Range (IQR) | 2.0% | 3.6% |
| Standard Deviation (Sample) | 2.0% | 2.5% |
| Standard Deviation (Population) | 2.0% | 2.4% |
Demographics Similar to Immigrants from Peru and Immigrants from Nigeria by 6th Grade
In terms of 6th grade, the demographic groups most similar to Immigrants from Peru are Immigrants from Afghanistan (96.2%, a difference of 0.0%), Immigrants from Thailand (96.3%, a difference of 0.010%), Yaqui (96.3%, a difference of 0.020%), Immigrants from Western Africa (96.3%, a difference of 0.020%), and Immigrants from Ghana (96.3%, a difference of 0.030%). Similarly, the demographic groups most similar to Immigrants from Nigeria are Immigrants from Colombia (96.4%, a difference of 0.010%), Armenian (96.4%, a difference of 0.020%), Immigrants from Jamaica (96.4%, a difference of 0.020%), Ghanaian (96.4%, a difference of 0.030%), and Afghan (96.4%, a difference of 0.030%).
| Demographics | Rating | Rank | 6th Grade |
| Peruvians | 0.4 /100 | #260 | Tragic 96.4% |
| Immigrants | Sierra Leone | 0.4 /100 | #261 | Tragic 96.4% |
| Immigrants | Nigeria | 0.3 /100 | #262 | Tragic 96.4% |
| Immigrants | Colombia | 0.3 /100 | #263 | Tragic 96.4% |
| Armenians | 0.3 /100 | #264 | Tragic 96.4% |
| Immigrants | Jamaica | 0.2 /100 | #265 | Tragic 96.4% |
| Ghanaians | 0.2 /100 | #266 | Tragic 96.4% |
| Afghans | 0.2 /100 | #267 | Tragic 96.4% |
| Immigrants | Uzbekistan | 0.2 /100 | #268 | Tragic 96.3% |
| West Indians | 0.2 /100 | #269 | Tragic 96.3% |
| Immigrants | South America | 0.2 /100 | #270 | Tragic 96.3% |
| Immigrants | Hong Kong | 0.2 /100 | #271 | Tragic 96.3% |
| Immigrants | Bolivia | 0.1 /100 | #272 | Tragic 96.3% |
| Immigrants | Cameroon | 0.1 /100 | #273 | Tragic 96.3% |
| Immigrants | Philippines | 0.1 /100 | #274 | Tragic 96.3% |
| Immigrants | Ghana | 0.1 /100 | #275 | Tragic 96.3% |
| Yaqui | 0.1 /100 | #276 | Tragic 96.3% |
| Immigrants | Western Africa | 0.1 /100 | #277 | Tragic 96.3% |
| Immigrants | Thailand | 0.1 /100 | #278 | Tragic 96.3% |
| Immigrants | Peru | 0.1 /100 | #279 | Tragic 96.2% |
| Immigrants | Afghanistan | 0.1 /100 | #280 | Tragic 96.2% |