Comanche vs Immigrants from Australia 6th Grade
COMPARE
Comanche
Immigrants from Australia
6th Grade
6th Grade Comparison
Comanche
Immigrants from Australia
97.0%
6TH GRADE
37.9/ 100
METRIC RATING
181st/ 347
METRIC RANK
97.5%
6TH GRADE
98.8/ 100
METRIC RATING
89th/ 347
METRIC RANK
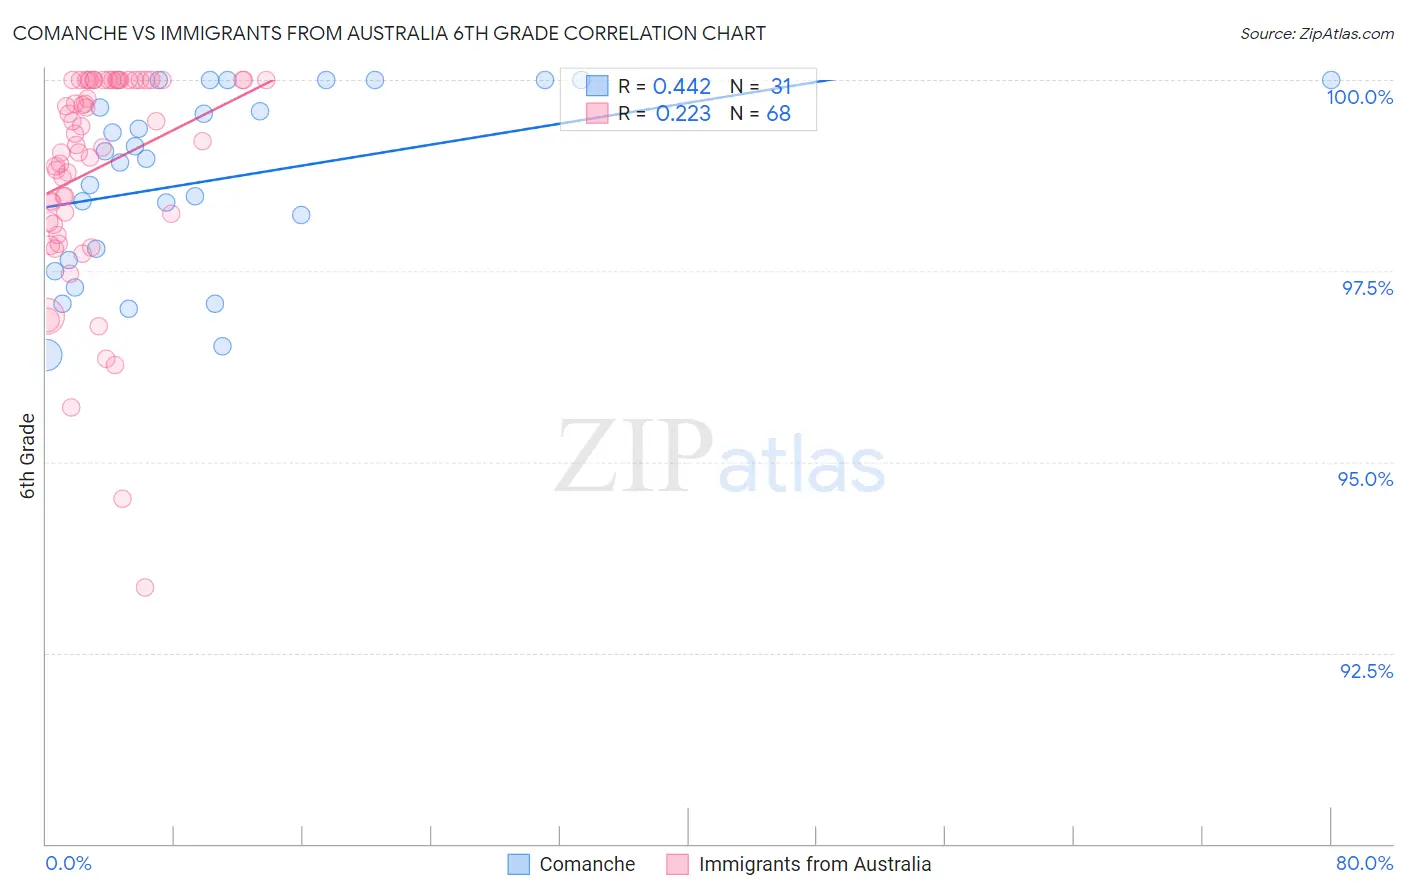
Comanche vs Immigrants from Australia 6th Grade Correlation Chart
The statistical analysis conducted on geographies consisting of 109,786,530 people shows a moderate positive correlation between the proportion of Comanche and percentage of population with at least 6th grade education in the United States with a correlation coefficient (R) of 0.442 and weighted average of 97.0%. Similarly, the statistical analysis conducted on geographies consisting of 227,203,469 people shows a weak positive correlation between the proportion of Immigrants from Australia and percentage of population with at least 6th grade education in the United States with a correlation coefficient (R) of 0.223 and weighted average of 97.5%, a difference of 0.56%.
6th Grade Correlation Summary
| Measurement | Comanche | Immigrants from Australia |
| Minimum | 96.4% | 93.4% |
| Maximum | 100.0% | 100.0% |
| Range | 3.6% | 6.6% |
| Mean | 98.7% | 98.8% |
| Median | 99.0% | 99.3% |
| Interquartile 25% (IQ1) | 97.6% | 98.2% |
| Interquartile 75% (IQ3) | 100.0% | 100.0% |
| Interquartile Range (IQR) | 2.4% | 1.8% |
| Standard Deviation (Sample) | 1.2% | 1.4% |
| Standard Deviation (Population) | 1.2% | 1.4% |
Similar Demographics by 6th Grade
Demographics Similar to Comanche by 6th Grade
In terms of 6th grade, the demographic groups most similar to Comanche are Immigrants from Spain (97.0%, a difference of 0.010%), Immigrants from Ukraine (97.0%, a difference of 0.010%), Immigrants from Venezuela (97.0%, a difference of 0.020%), Spanish American (97.0%, a difference of 0.020%), and Argentinean (97.0%, a difference of 0.020%).
| Demographics | Rating | Rank | 6th Grade |
| Venezuelans | 50.0 /100 | #174 | Average 97.0% |
| Immigrants | Kazakhstan | 47.3 /100 | #175 | Average 97.0% |
| Immigrants | Micronesia | 47.1 /100 | #176 | Average 97.0% |
| Mongolians | 46.7 /100 | #177 | Average 97.0% |
| Pakistanis | 46.0 /100 | #178 | Average 97.0% |
| Immigrants | Kenya | 45.3 /100 | #179 | Average 97.0% |
| Immigrants | Spain | 39.9 /100 | #180 | Fair 97.0% |
| Comanche | 37.9 /100 | #181 | Fair 97.0% |
| Immigrants | Ukraine | 35.6 /100 | #182 | Fair 97.0% |
| Immigrants | Venezuela | 34.5 /100 | #183 | Fair 97.0% |
| Spanish Americans | 33.5 /100 | #184 | Fair 97.0% |
| Argentineans | 33.0 /100 | #185 | Fair 97.0% |
| Immigrants | Egypt | 31.4 /100 | #186 | Fair 97.0% |
| Guamanians/Chamorros | 30.6 /100 | #187 | Fair 97.0% |
| Immigrants | Argentina | 30.4 /100 | #188 | Fair 97.0% |
Demographics Similar to Immigrants from Australia by 6th Grade
In terms of 6th grade, the demographic groups most similar to Immigrants from Australia are Puget Sound Salish (97.5%, a difference of 0.0%), Immigrants from South Africa (97.5%, a difference of 0.0%), Pueblo (97.5%, a difference of 0.0%), Delaware (97.6%, a difference of 0.010%), and Immigrants from Belgium (97.5%, a difference of 0.010%).
| Demographics | Rating | Rank | 6th Grade |
| Zimbabweans | 99.1 /100 | #82 | Exceptional 97.6% |
| Potawatomi | 99.1 /100 | #83 | Exceptional 97.6% |
| Shoshone | 99.0 /100 | #84 | Exceptional 97.6% |
| Delaware | 98.9 /100 | #85 | Exceptional 97.6% |
| Immigrants | Belgium | 98.9 /100 | #86 | Exceptional 97.5% |
| Puget Sound Salish | 98.9 /100 | #87 | Exceptional 97.5% |
| Immigrants | South Africa | 98.9 /100 | #88 | Exceptional 97.5% |
| Immigrants | Australia | 98.8 /100 | #89 | Exceptional 97.5% |
| Pueblo | 98.8 /100 | #90 | Exceptional 97.5% |
| Immigrants | Western Europe | 98.8 /100 | #91 | Exceptional 97.5% |
| Romanians | 98.7 /100 | #92 | Exceptional 97.5% |
| Cree | 98.7 /100 | #93 | Exceptional 97.5% |
| Cypriots | 98.7 /100 | #94 | Exceptional 97.5% |
| Immigrants | Ireland | 98.7 /100 | #95 | Exceptional 97.5% |
| Immigrants | Germany | 98.6 /100 | #96 | Exceptional 97.5% |