Comanche vs Immigrants from Asia 7th Grade
COMPARE
Comanche
Immigrants from Asia
7th Grade
7th Grade Comparison
Comanche
Immigrants from Asia
95.8%
7TH GRADE
21.1/ 100
METRIC RATING
203rd/ 347
METRIC RANK
95.5%
7TH GRADE
2.3/ 100
METRIC RATING
237th/ 347
METRIC RANK
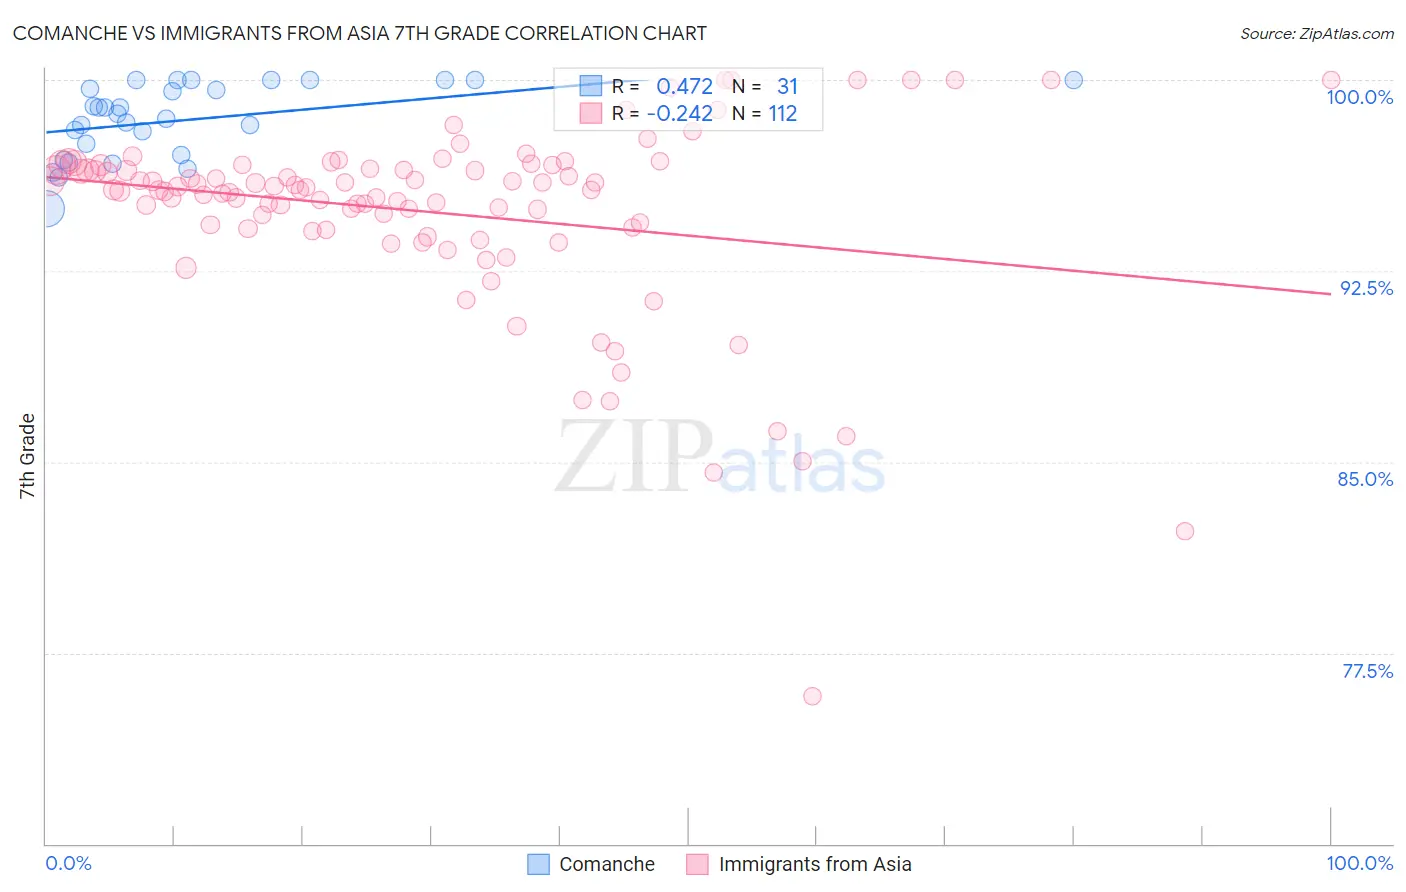
Comanche vs Immigrants from Asia 7th Grade Correlation Chart
The statistical analysis conducted on geographies consisting of 109,786,530 people shows a moderate positive correlation between the proportion of Comanche and percentage of population with at least 7th grade education in the United States with a correlation coefficient (R) of 0.472 and weighted average of 95.8%. Similarly, the statistical analysis conducted on geographies consisting of 549,167,442 people shows a weak negative correlation between the proportion of Immigrants from Asia and percentage of population with at least 7th grade education in the United States with a correlation coefficient (R) of -0.242 and weighted average of 95.5%, a difference of 0.37%.
7th Grade Correlation Summary
| Measurement | Comanche | Immigrants from Asia |
| Minimum | 94.9% | 75.8% |
| Maximum | 100.0% | 100.0% |
| Range | 5.1% | 24.2% |
| Mean | 98.4% | 94.8% |
| Median | 98.7% | 95.7% |
| Interquartile 25% (IQ1) | 97.1% | 94.2% |
| Interquartile 75% (IQ3) | 100.0% | 96.6% |
| Interquartile Range (IQR) | 2.9% | 2.4% |
| Standard Deviation (Sample) | 1.4% | 3.8% |
| Standard Deviation (Population) | 1.4% | 3.7% |
Similar Demographics by 7th Grade
Demographics Similar to Comanche by 7th Grade
In terms of 7th grade, the demographic groups most similar to Comanche are Immigrants from Northern Africa (95.8%, a difference of 0.0%), Immigrants from Argentina (95.9%, a difference of 0.010%), Assyrian/Chaldean/Syriac (95.8%, a difference of 0.010%), Guamanian/Chamorro (95.9%, a difference of 0.020%), and Argentinean (95.9%, a difference of 0.020%).
| Demographics | Rating | Rank | 7th Grade |
| Apache | 27.6 /100 | #196 | Fair 95.9% |
| Immigrants | Zaire | 26.7 /100 | #197 | Fair 95.9% |
| Paraguayans | 24.8 /100 | #198 | Fair 95.9% |
| Guamanians/Chamorros | 23.5 /100 | #199 | Fair 95.9% |
| Argentineans | 23.2 /100 | #200 | Fair 95.9% |
| Immigrants | Argentina | 21.9 /100 | #201 | Fair 95.9% |
| Immigrants | Northern Africa | 21.4 /100 | #202 | Fair 95.8% |
| Comanche | 21.1 /100 | #203 | Fair 95.8% |
| Assyrians/Chaldeans/Syriacs | 20.5 /100 | #204 | Fair 95.8% |
| Moroccans | 18.9 /100 | #205 | Poor 95.8% |
| Africans | 17.6 /100 | #206 | Poor 95.8% |
| Navajo | 17.0 /100 | #207 | Poor 95.8% |
| Immigrants | Sudan | 17.0 /100 | #208 | Poor 95.8% |
| Dutch West Indians | 16.1 /100 | #209 | Poor 95.8% |
| Hawaiians | 16.0 /100 | #210 | Poor 95.8% |
Demographics Similar to Immigrants from Asia by 7th Grade
In terms of 7th grade, the demographic groups most similar to Immigrants from Asia are Indian (Asian) (95.5%, a difference of 0.0%), Asian (95.5%, a difference of 0.010%), Jamaican (95.5%, a difference of 0.010%), Immigrants from Africa (95.5%, a difference of 0.020%), and Immigrants from Sierra Leone (95.5%, a difference of 0.030%).
| Demographics | Rating | Rank | 7th Grade |
| Natives/Alaskans | 4.2 /100 | #230 | Tragic 95.6% |
| Senegalese | 4.0 /100 | #231 | Tragic 95.6% |
| Costa Ricans | 3.3 /100 | #232 | Tragic 95.5% |
| Immigrants | Indonesia | 3.3 /100 | #233 | Tragic 95.5% |
| Nigerians | 3.0 /100 | #234 | Tragic 95.5% |
| Immigrants | Africa | 2.7 /100 | #235 | Tragic 95.5% |
| Asians | 2.6 /100 | #236 | Tragic 95.5% |
| Immigrants | Asia | 2.3 /100 | #237 | Tragic 95.5% |
| Indians (Asian) | 2.3 /100 | #238 | Tragic 95.5% |
| Jamaicans | 2.2 /100 | #239 | Tragic 95.5% |
| Immigrants | Sierra Leone | 2.0 /100 | #240 | Tragic 95.5% |
| South American Indians | 2.0 /100 | #241 | Tragic 95.5% |
| Immigrants | Senegal | 1.9 /100 | #242 | Tragic 95.5% |
| U.S. Virgin Islanders | 1.6 /100 | #243 | Tragic 95.4% |
| Uruguayans | 1.6 /100 | #244 | Tragic 95.4% |