Comanche vs Alaskan Athabascan 7th Grade
COMPARE
Comanche
Alaskan Athabascan
7th Grade
7th Grade Comparison
Comanche
Alaskan Athabascans
95.8%
7TH GRADE
21.1/ 100
METRIC RATING
203rd/ 347
METRIC RANK
97.6%
7TH GRADE
100.0/ 100
METRIC RATING
11th/ 347
METRIC RANK
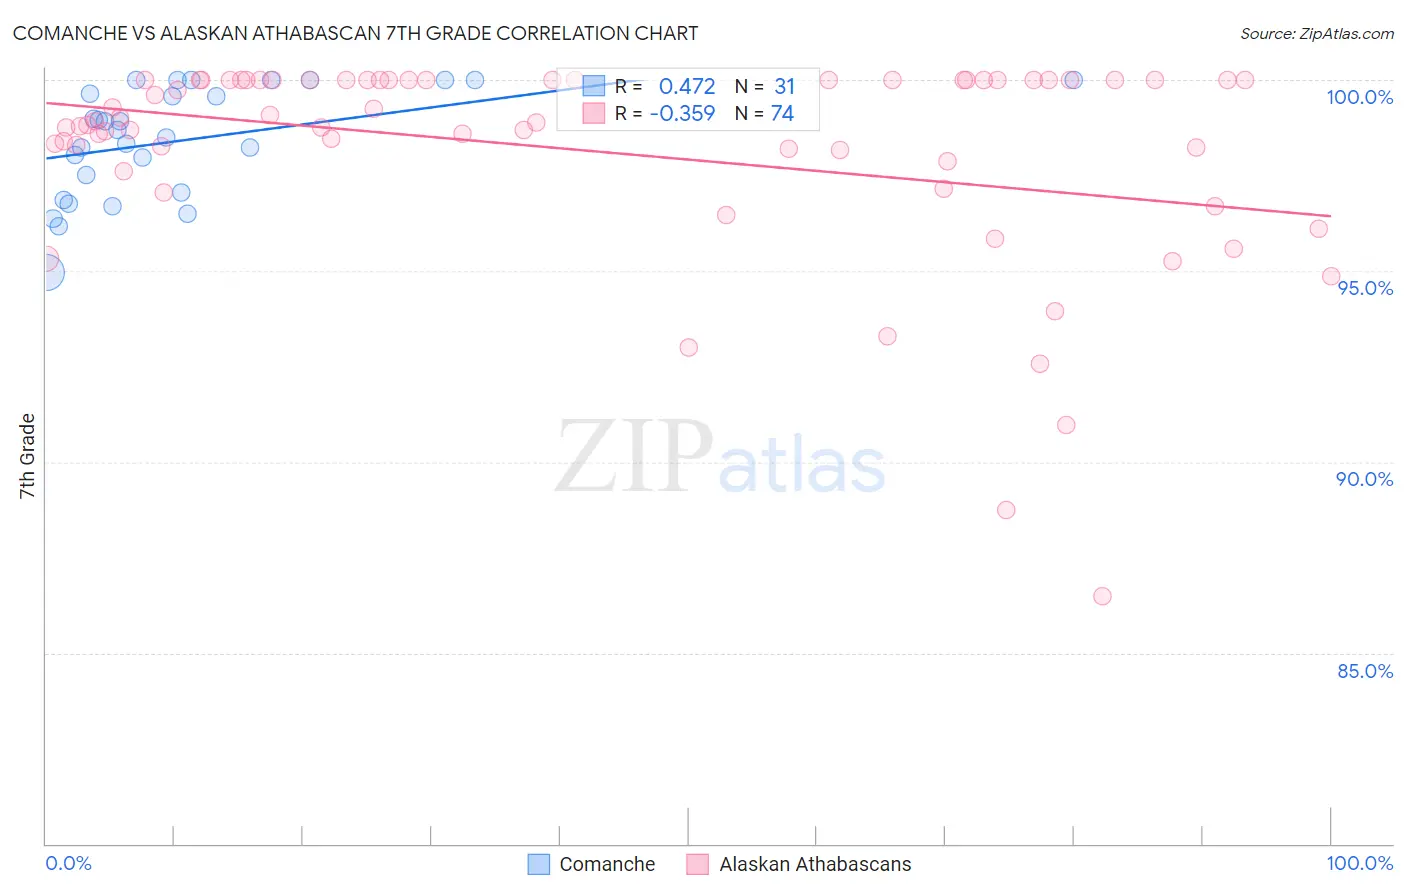
Comanche vs Alaskan Athabascan 7th Grade Correlation Chart
The statistical analysis conducted on geographies consisting of 109,786,530 people shows a moderate positive correlation between the proportion of Comanche and percentage of population with at least 7th grade education in the United States with a correlation coefficient (R) of 0.472 and weighted average of 95.8%. Similarly, the statistical analysis conducted on geographies consisting of 45,820,365 people shows a mild negative correlation between the proportion of Alaskan Athabascans and percentage of population with at least 7th grade education in the United States with a correlation coefficient (R) of -0.359 and weighted average of 97.6%, a difference of 1.9%.
7th Grade Correlation Summary
| Measurement | Comanche | Alaskan Athabascan |
| Minimum | 94.9% | 86.5% |
| Maximum | 100.0% | 100.0% |
| Range | 5.1% | 13.5% |
| Mean | 98.4% | 98.2% |
| Median | 98.7% | 98.9% |
| Interquartile 25% (IQ1) | 97.1% | 97.9% |
| Interquartile 75% (IQ3) | 100.0% | 100.0% |
| Interquartile Range (IQR) | 2.9% | 2.1% |
| Standard Deviation (Sample) | 1.4% | 2.7% |
| Standard Deviation (Population) | 1.4% | 2.7% |
Similar Demographics by 7th Grade
Demographics Similar to Comanche by 7th Grade
In terms of 7th grade, the demographic groups most similar to Comanche are Immigrants from Northern Africa (95.8%, a difference of 0.0%), Immigrants from Argentina (95.9%, a difference of 0.010%), Assyrian/Chaldean/Syriac (95.8%, a difference of 0.010%), Guamanian/Chamorro (95.9%, a difference of 0.020%), and Argentinean (95.9%, a difference of 0.020%).
| Demographics | Rating | Rank | 7th Grade |
| Apache | 27.6 /100 | #196 | Fair 95.9% |
| Immigrants | Zaire | 26.7 /100 | #197 | Fair 95.9% |
| Paraguayans | 24.8 /100 | #198 | Fair 95.9% |
| Guamanians/Chamorros | 23.5 /100 | #199 | Fair 95.9% |
| Argentineans | 23.2 /100 | #200 | Fair 95.9% |
| Immigrants | Argentina | 21.9 /100 | #201 | Fair 95.9% |
| Immigrants | Northern Africa | 21.4 /100 | #202 | Fair 95.8% |
| Comanche | 21.1 /100 | #203 | Fair 95.8% |
| Assyrians/Chaldeans/Syriacs | 20.5 /100 | #204 | Fair 95.8% |
| Moroccans | 18.9 /100 | #205 | Poor 95.8% |
| Africans | 17.6 /100 | #206 | Poor 95.8% |
| Navajo | 17.0 /100 | #207 | Poor 95.8% |
| Immigrants | Sudan | 17.0 /100 | #208 | Poor 95.8% |
| Dutch West Indians | 16.1 /100 | #209 | Poor 95.8% |
| Hawaiians | 16.0 /100 | #210 | Poor 95.8% |
Demographics Similar to Alaskan Athabascans by 7th Grade
In terms of 7th grade, the demographic groups most similar to Alaskan Athabascans are Slovene (97.6%, a difference of 0.010%), Polish (97.6%, a difference of 0.010%), Swedish (97.6%, a difference of 0.040%), Pennsylvania German (97.6%, a difference of 0.050%), and English (97.6%, a difference of 0.060%).
| Demographics | Rating | Rank | 7th Grade |
| Ottawa | 100.0 /100 | #4 | Exceptional 98.1% |
| Dutch | 100.0 /100 | #5 | Exceptional 97.9% |
| Tsimshian | 100.0 /100 | #6 | Exceptional 97.8% |
| Norwegians | 100.0 /100 | #7 | Exceptional 97.8% |
| Slovaks | 100.0 /100 | #8 | Exceptional 97.8% |
| Germans | 100.0 /100 | #9 | Exceptional 97.7% |
| Slovenes | 100.0 /100 | #10 | Exceptional 97.6% |
| Alaskan Athabascans | 100.0 /100 | #11 | Exceptional 97.6% |
| Poles | 100.0 /100 | #12 | Exceptional 97.6% |
| Swedes | 100.0 /100 | #13 | Exceptional 97.6% |
| Pennsylvania Germans | 100.0 /100 | #14 | Exceptional 97.6% |
| English | 100.0 /100 | #15 | Exceptional 97.6% |
| Irish | 100.0 /100 | #16 | Exceptional 97.5% |
| Scottish | 100.0 /100 | #17 | Exceptional 97.5% |
| Tlingit-Haida | 100.0 /100 | #18 | Exceptional 97.5% |