Colville vs Aleut College, Under 1 year
COMPARE
Colville
Aleut
College, Under 1 year
College, Under 1 year Comparison
Colville
Aleuts
62.1%
COLLEGE, UNDER 1 YEAR
1.0/ 100
METRIC RATING
244th/ 347
METRIC RANK
62.2%
COLLEGE, UNDER 1 YEAR
1.1/ 100
METRIC RATING
240th/ 347
METRIC RANK
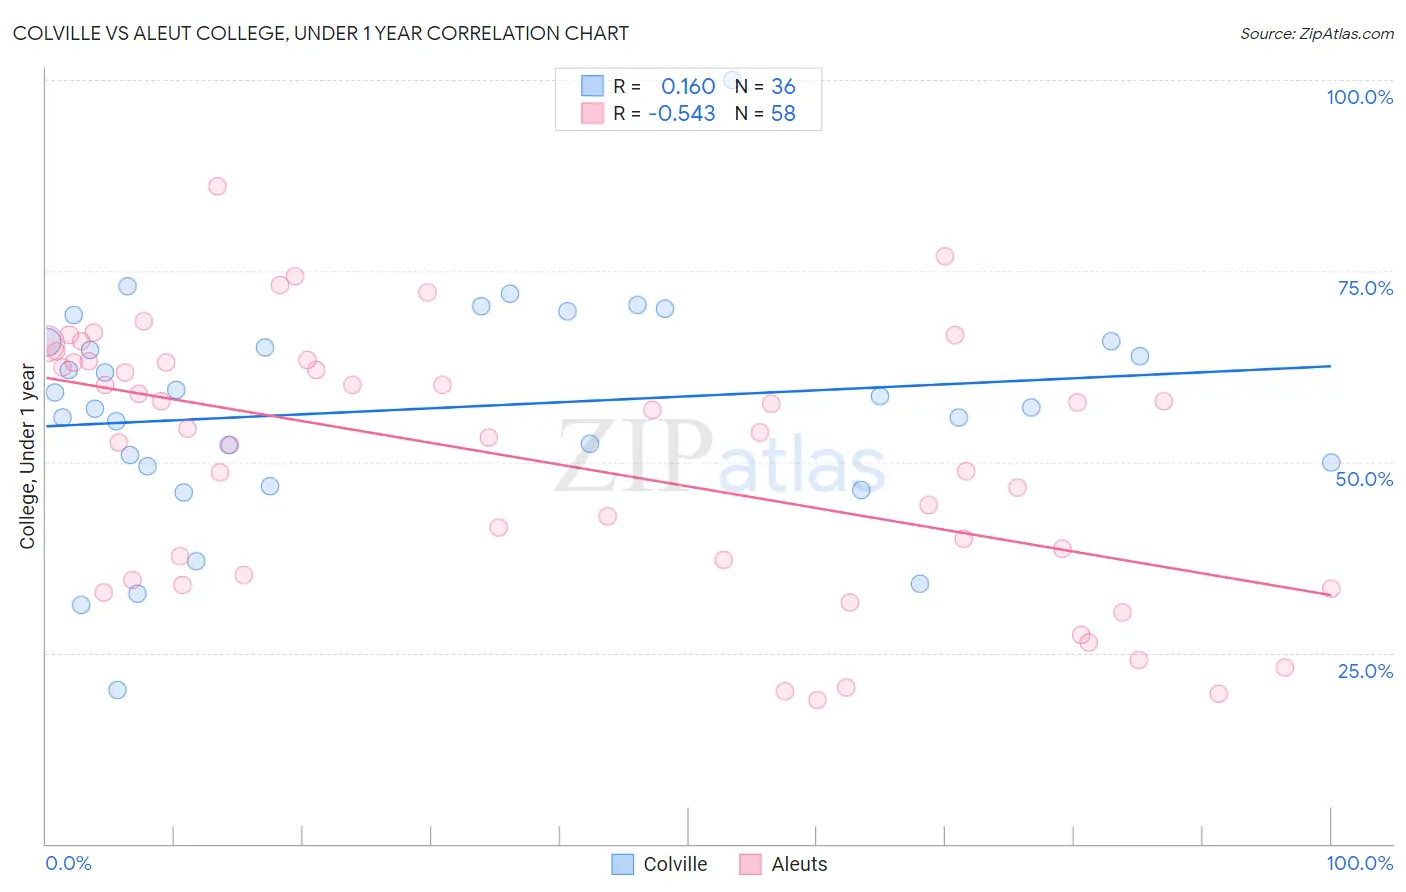
Colville vs Aleut College, Under 1 year Correlation Chart
The statistical analysis conducted on geographies consisting of 34,687,961 people shows a poor positive correlation between the proportion of Colville and percentage of population with at least college, under 1 year education in the United States with a correlation coefficient (R) of 0.160 and weighted average of 62.1%. Similarly, the statistical analysis conducted on geographies consisting of 61,782,940 people shows a substantial negative correlation between the proportion of Aleuts and percentage of population with at least college, under 1 year education in the United States with a correlation coefficient (R) of -0.543 and weighted average of 62.2%, a difference of 0.18%.
College, Under 1 year Correlation Summary
| Measurement | Colville | Aleut |
| Minimum | 20.2% | 18.8% |
| Maximum | 100.0% | 86.1% |
| Range | 79.8% | 67.4% |
| Mean | 57.0% | 50.3% |
| Median | 57.9% | 54.1% |
| Interquartile 25% (IQ1) | 49.8% | 35.3% |
| Interquartile 75% (IQ3) | 65.7% | 63.1% |
| Interquartile Range (IQR) | 16.0% | 27.8% |
| Standard Deviation (Sample) | 14.8% | 16.9% |
| Standard Deviation (Population) | 14.6% | 16.7% |
Demographics Similar to Colville and Aleuts by College, Under 1 year
In terms of college, under 1 year, the demographic groups most similar to Colville are Delaware (62.1%, a difference of 0.060%), Hawaiian (62.1%, a difference of 0.090%), Malaysian (62.2%, a difference of 0.12%), Ottawa (62.2%, a difference of 0.17%), and Nepalese (62.2%, a difference of 0.18%). Similarly, the demographic groups most similar to Aleuts are Nepalese (62.2%, a difference of 0.0%), Ottawa (62.2%, a difference of 0.010%), Malaysian (62.2%, a difference of 0.060%), Hawaiian (62.1%, a difference of 0.090%), and Delaware (62.1%, a difference of 0.24%).
| Demographics | Rating | Rank | College, Under 1 year |
| Osage | 2.2 /100 | #232 | Tragic 62.7% |
| Iroquois | 2.0 /100 | #233 | Tragic 62.6% |
| Chippewa | 2.0 /100 | #234 | Tragic 62.6% |
| Spanish Americans | 1.9 /100 | #235 | Tragic 62.6% |
| Immigrants | Immigrants | 1.7 /100 | #236 | Tragic 62.5% |
| Immigrants | Burma/Myanmar | 1.6 /100 | #237 | Tragic 62.5% |
| French American Indians | 1.5 /100 | #238 | Tragic 62.4% |
| Nepalese | 1.1 /100 | #239 | Tragic 62.2% |
| Aleuts | 1.1 /100 | #240 | Tragic 62.2% |
| Ottawa | 1.1 /100 | #241 | Tragic 62.2% |
| Malaysians | 1.1 /100 | #242 | Tragic 62.2% |
| Hawaiians | 1.1 /100 | #243 | Tragic 62.1% |
| Colville | 1.0 /100 | #244 | Tragic 62.1% |
| Delaware | 0.9 /100 | #245 | Tragic 62.1% |
| Marshallese | 0.8 /100 | #246 | Tragic 61.9% |
| Immigrants | Liberia | 0.8 /100 | #247 | Tragic 61.9% |
| Potawatomi | 0.6 /100 | #248 | Tragic 61.8% |
| Vietnamese | 0.5 /100 | #249 | Tragic 61.7% |
| Immigrants | Congo | 0.5 /100 | #250 | Tragic 61.7% |
| Immigrants | Micronesia | 0.5 /100 | #251 | Tragic 61.5% |
| West Indians | 0.4 /100 | #252 | Tragic 61.5% |