Colombian vs Mexican American Indian 8th Grade
COMPARE
Colombian
Mexican American Indian
8th Grade
8th Grade Comparison
Colombians
Mexican American Indians
95.0%
8TH GRADE
0.7/ 100
METRIC RATING
256th/ 347
METRIC RANK
92.1%
8TH GRADE
0.0/ 100
METRIC RATING
335th/ 347
METRIC RANK
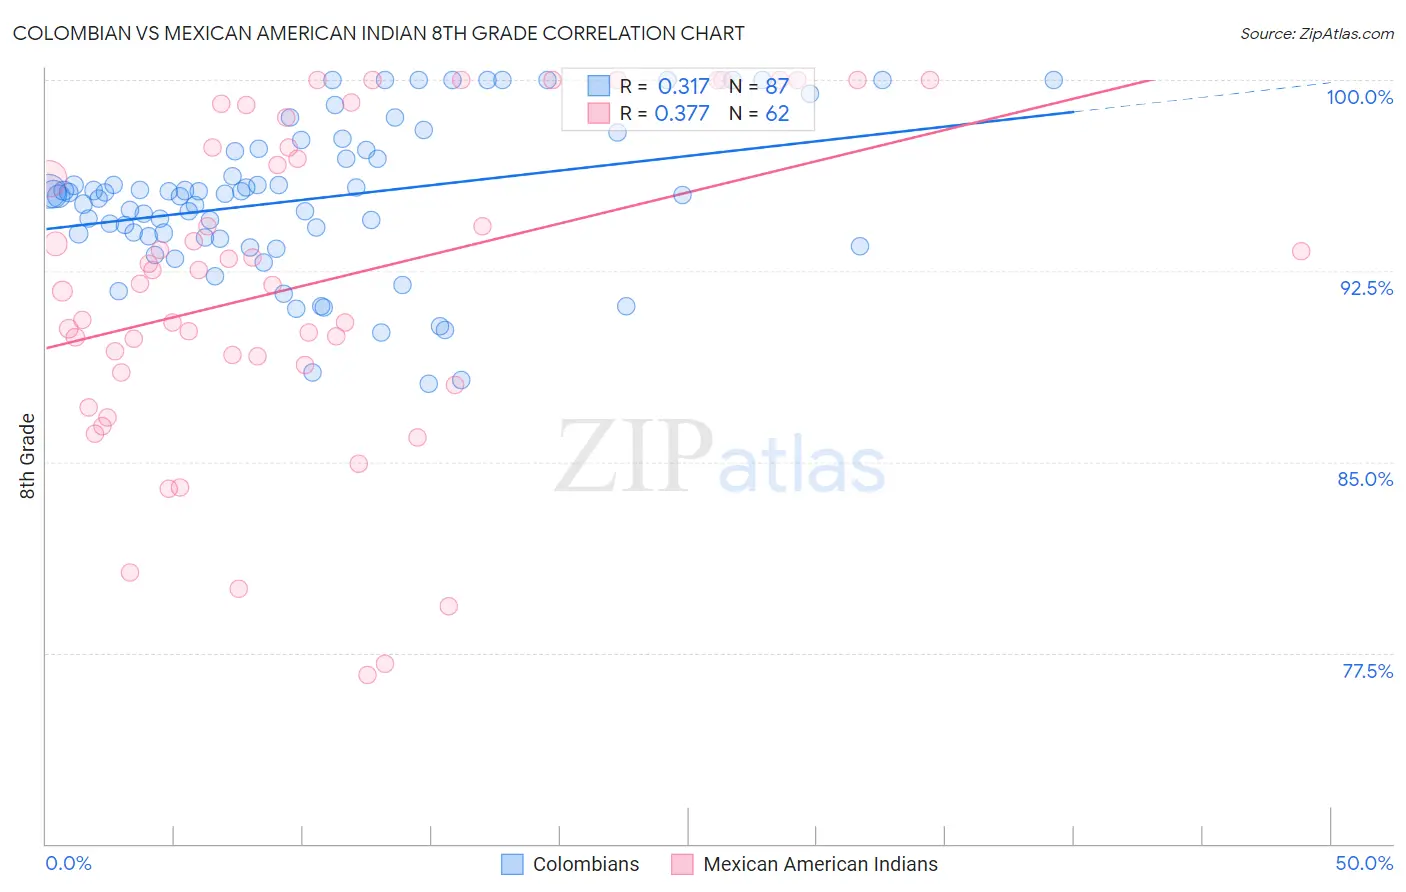
Colombian vs Mexican American Indian 8th Grade Correlation Chart
The statistical analysis conducted on geographies consisting of 419,655,116 people shows a mild positive correlation between the proportion of Colombians and percentage of population with at least 8th grade education in the United States with a correlation coefficient (R) of 0.317 and weighted average of 95.0%. Similarly, the statistical analysis conducted on geographies consisting of 317,621,104 people shows a mild positive correlation between the proportion of Mexican American Indians and percentage of population with at least 8th grade education in the United States with a correlation coefficient (R) of 0.377 and weighted average of 92.1%, a difference of 3.1%.
8th Grade Correlation Summary
| Measurement | Colombian | Mexican American Indian |
| Minimum | 88.1% | 76.6% |
| Maximum | 100.0% | 100.0% |
| Range | 11.9% | 23.4% |
| Mean | 95.3% | 92.0% |
| Median | 95.5% | 92.3% |
| Interquartile 25% (IQ1) | 93.8% | 88.8% |
| Interquartile 75% (IQ3) | 97.2% | 97.4% |
| Interquartile Range (IQR) | 3.4% | 8.6% |
| Standard Deviation (Sample) | 3.0% | 6.2% |
| Standard Deviation (Population) | 2.9% | 6.2% |
Similar Demographics by 8th Grade
Demographics Similar to Colombians by 8th Grade
In terms of 8th grade, the demographic groups most similar to Colombians are Immigrants from Somalia (95.0%, a difference of 0.010%), Afghan (94.9%, a difference of 0.010%), Immigrants from Congo (94.9%, a difference of 0.020%), Ghanaian (94.9%, a difference of 0.020%), and Immigrants from Cameroon (95.0%, a difference of 0.030%).
| Demographics | Rating | Rank | 8th Grade |
| Immigrants | China | 1.1 /100 | #249 | Tragic 95.0% |
| Koreans | 1.1 /100 | #250 | Tragic 95.0% |
| Bolivians | 1.0 /100 | #251 | Tragic 95.0% |
| Immigrants | Ethiopia | 1.0 /100 | #252 | Tragic 95.0% |
| U.S. Virgin Islanders | 0.9 /100 | #253 | Tragic 95.0% |
| Immigrants | Cameroon | 0.8 /100 | #254 | Tragic 95.0% |
| Immigrants | Somalia | 0.7 /100 | #255 | Tragic 95.0% |
| Colombians | 0.7 /100 | #256 | Tragic 95.0% |
| Afghans | 0.6 /100 | #257 | Tragic 94.9% |
| Immigrants | Congo | 0.6 /100 | #258 | Tragic 94.9% |
| Ghanaians | 0.6 /100 | #259 | Tragic 94.9% |
| Immigrants | Jamaica | 0.6 /100 | #260 | Tragic 94.9% |
| Immigrants | Costa Rica | 0.5 /100 | #261 | Tragic 94.9% |
| Immigrants | Nigeria | 0.4 /100 | #262 | Tragic 94.9% |
| Immigrants | Hong Kong | 0.4 /100 | #263 | Tragic 94.9% |
Demographics Similar to Mexican American Indians by 8th Grade
In terms of 8th grade, the demographic groups most similar to Mexican American Indians are Immigrants from Yemen (92.1%, a difference of 0.050%), Hispanic or Latino (92.2%, a difference of 0.11%), Immigrants from Honduras (91.9%, a difference of 0.19%), Immigrants from Dominican Republic (92.3%, a difference of 0.22%), and Honduran (92.3%, a difference of 0.24%).
| Demographics | Rating | Rank | 8th Grade |
| Immigrants | Nicaragua | 0.0 /100 | #328 | Tragic 92.5% |
| Immigrants | Cabo Verde | 0.0 /100 | #329 | Tragic 92.4% |
| Immigrants | Armenia | 0.0 /100 | #330 | Tragic 92.3% |
| Hondurans | 0.0 /100 | #331 | Tragic 92.3% |
| Immigrants | Dominican Republic | 0.0 /100 | #332 | Tragic 92.3% |
| Hispanics or Latinos | 0.0 /100 | #333 | Tragic 92.2% |
| Immigrants | Yemen | 0.0 /100 | #334 | Tragic 92.1% |
| Mexican American Indians | 0.0 /100 | #335 | Tragic 92.1% |
| Immigrants | Honduras | 0.0 /100 | #336 | Tragic 91.9% |
| Immigrants | Latin America | 0.0 /100 | #337 | Tragic 91.7% |
| Central Americans | 0.0 /100 | #338 | Tragic 91.6% |
| Mexicans | 0.0 /100 | #339 | Tragic 91.4% |
| Yakama | 0.0 /100 | #340 | Tragic 91.2% |
| Guatemalans | 0.0 /100 | #341 | Tragic 91.1% |
| Salvadorans | 0.0 /100 | #342 | Tragic 90.9% |