Colombian vs Mexican American Indian 3rd Grade
COMPARE
Colombian
Mexican American Indian
3rd Grade
3rd Grade Comparison
Colombians
Mexican American Indians
97.4%
3RD GRADE
1.8/ 100
METRIC RATING
237th/ 347
METRIC RANK
96.4%
3RD GRADE
0.0/ 100
METRIC RATING
325th/ 347
METRIC RANK
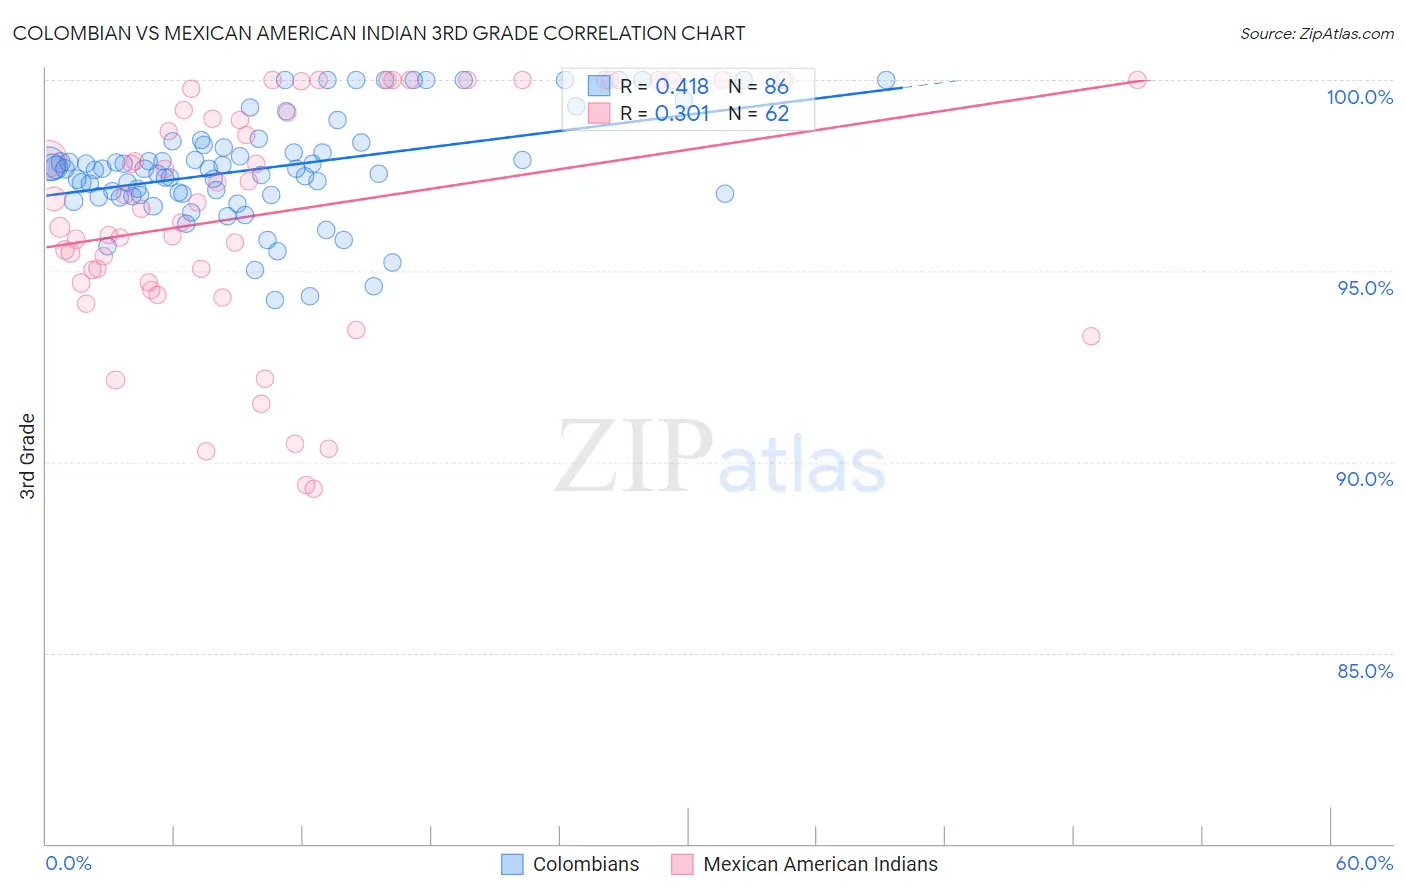
Colombian vs Mexican American Indian 3rd Grade Correlation Chart
The statistical analysis conducted on geographies consisting of 419,700,680 people shows a moderate positive correlation between the proportion of Colombians and percentage of population with at least 3rd grade education in the United States with a correlation coefficient (R) of 0.418 and weighted average of 97.4%. Similarly, the statistical analysis conducted on geographies consisting of 317,619,717 people shows a mild positive correlation between the proportion of Mexican American Indians and percentage of population with at least 3rd grade education in the United States with a correlation coefficient (R) of 0.301 and weighted average of 96.4%, a difference of 1.1%.
3rd Grade Correlation Summary
| Measurement | Colombian | Mexican American Indian |
| Minimum | 94.3% | 89.3% |
| Maximum | 100.0% | 100.0% |
| Range | 5.7% | 10.7% |
| Mean | 97.7% | 96.6% |
| Median | 97.7% | 96.8% |
| Interquartile 25% (IQ1) | 97.0% | 94.7% |
| Interquartile 75% (IQ3) | 98.3% | 99.8% |
| Interquartile Range (IQR) | 1.3% | 5.1% |
| Standard Deviation (Sample) | 1.4% | 3.1% |
| Standard Deviation (Population) | 1.4% | 3.0% |
Similar Demographics by 3rd Grade
Demographics Similar to Colombians by 3rd Grade
In terms of 3rd grade, the demographic groups most similar to Colombians are Immigrants from Iraq (97.4%, a difference of 0.0%), Liberian (97.4%, a difference of 0.0%), Immigrants from Uruguay (97.4%, a difference of 0.0%), Immigrants from Eastern Asia (97.4%, a difference of 0.010%), and Nigerian (97.4%, a difference of 0.010%).
| Demographics | Rating | Rank | 3rd Grade |
| Immigrants | Pakistan | 2.7 /100 | #230 | Tragic 97.5% |
| Immigrants | Costa Rica | 2.7 /100 | #231 | Tragic 97.5% |
| Immigrants | Western Asia | 2.6 /100 | #232 | Tragic 97.5% |
| Immigrants | Malaysia | 2.4 /100 | #233 | Tragic 97.5% |
| Immigrants | Eastern Asia | 1.9 /100 | #234 | Tragic 97.4% |
| Immigrants | Iraq | 1.8 /100 | #235 | Tragic 97.4% |
| Liberians | 1.8 /100 | #236 | Tragic 97.4% |
| Colombians | 1.8 /100 | #237 | Tragic 97.4% |
| Immigrants | Uruguay | 1.7 /100 | #238 | Tragic 97.4% |
| Nigerians | 1.6 /100 | #239 | Tragic 97.4% |
| U.S. Virgin Islanders | 1.4 /100 | #240 | Tragic 97.4% |
| Immigrants | Indonesia | 1.4 /100 | #241 | Tragic 97.4% |
| Koreans | 1.3 /100 | #242 | Tragic 97.4% |
| Indians (Asian) | 1.3 /100 | #243 | Tragic 97.4% |
| Asians | 1.1 /100 | #244 | Tragic 97.4% |
Demographics Similar to Mexican American Indians by 3rd Grade
In terms of 3rd grade, the demographic groups most similar to Mexican American Indians are Dominican (96.4%, a difference of 0.010%), Immigrants from Vietnam (96.4%, a difference of 0.030%), Japanese (96.4%, a difference of 0.040%), Bangladeshi (96.3%, a difference of 0.050%), and Immigrants from Honduras (96.3%, a difference of 0.070%).
| Demographics | Rating | Rank | 3rd Grade |
| Hispanics or Latinos | 0.0 /100 | #318 | Tragic 96.5% |
| Vietnamese | 0.0 /100 | #319 | Tragic 96.5% |
| Immigrants | Nicaragua | 0.0 /100 | #320 | Tragic 96.5% |
| Indonesians | 0.0 /100 | #321 | Tragic 96.5% |
| Immigrants | Belize | 0.0 /100 | #322 | Tragic 96.5% |
| Hondurans | 0.0 /100 | #323 | Tragic 96.5% |
| Dominicans | 0.0 /100 | #324 | Tragic 96.4% |
| Mexican American Indians | 0.0 /100 | #325 | Tragic 96.4% |
| Immigrants | Vietnam | 0.0 /100 | #326 | Tragic 96.4% |
| Japanese | 0.0 /100 | #327 | Tragic 96.4% |
| Bangladeshis | 0.0 /100 | #328 | Tragic 96.3% |
| Immigrants | Honduras | 0.0 /100 | #329 | Tragic 96.3% |
| Immigrants | Armenia | 0.0 /100 | #330 | Tragic 96.3% |
| Immigrants | Latin America | 0.0 /100 | #331 | Tragic 96.2% |
| Mexicans | 0.0 /100 | #332 | Tragic 96.2% |