Colombian vs Immigrants from Barbados Doctorate Degree
COMPARE
Colombian
Immigrants from Barbados
Doctorate Degree
Doctorate Degree Comparison
Colombians
Immigrants from Barbados
1.7%
DOCTORATE DEGREE
16.1/ 100
METRIC RATING
208th/ 347
METRIC RANK
1.5%
DOCTORATE DEGREE
0.4/ 100
METRIC RATING
272nd/ 347
METRIC RANK
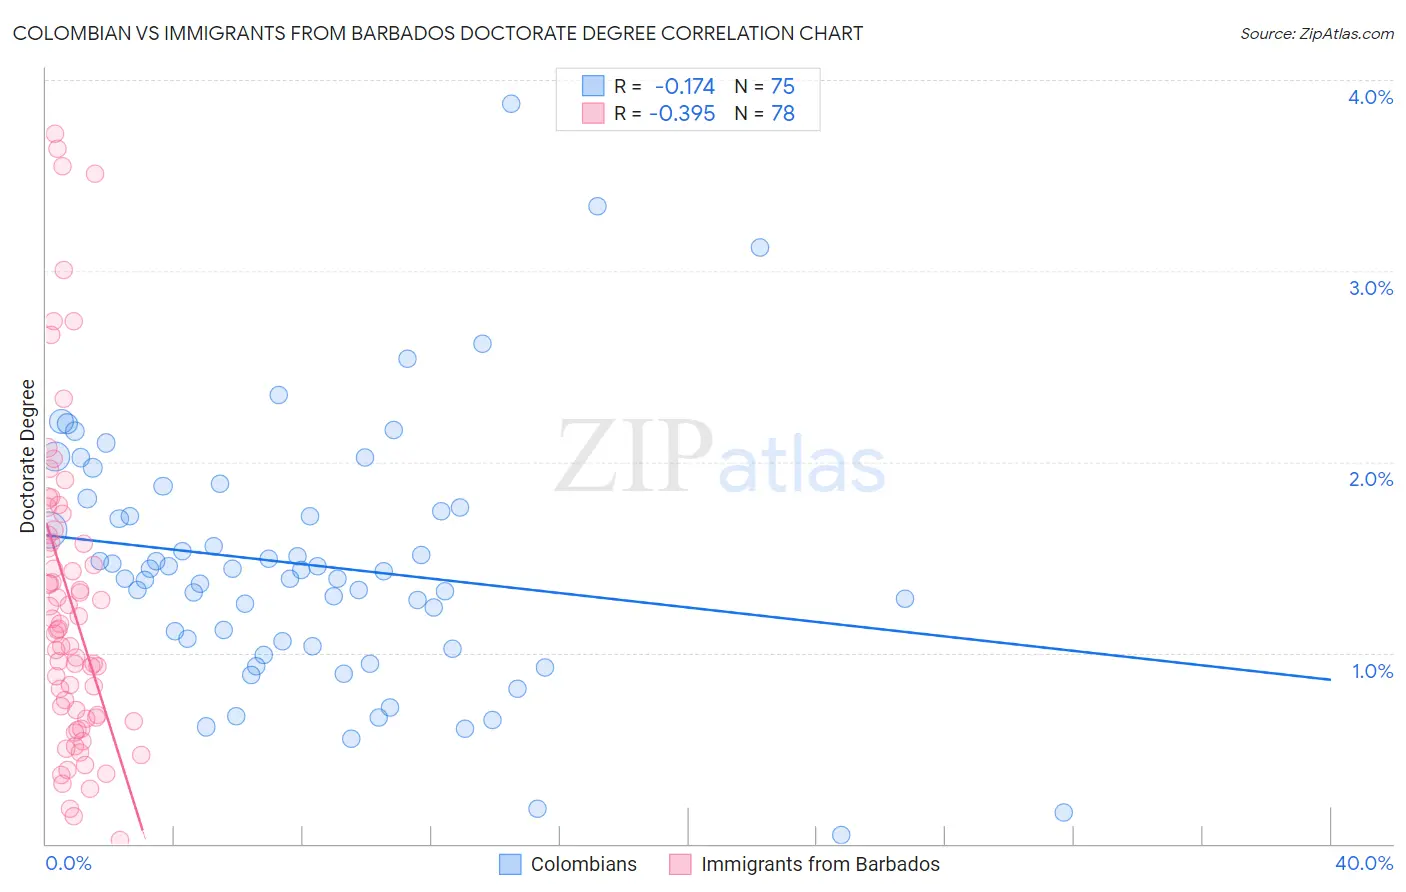
Colombian vs Immigrants from Barbados Doctorate Degree Correlation Chart
The statistical analysis conducted on geographies consisting of 415,824,999 people shows a poor negative correlation between the proportion of Colombians and percentage of population with at least doctorate degree education in the United States with a correlation coefficient (R) of -0.174 and weighted average of 1.7%. Similarly, the statistical analysis conducted on geographies consisting of 112,445,982 people shows a mild negative correlation between the proportion of Immigrants from Barbados and percentage of population with at least doctorate degree education in the United States with a correlation coefficient (R) of -0.395 and weighted average of 1.5%, a difference of 17.1%.
Doctorate Degree Correlation Summary
| Measurement | Colombian | Immigrants from Barbados |
| Minimum | 0.049% | 0.017% |
| Maximum | 3.9% | 3.7% |
| Range | 3.8% | 3.7% |
| Mean | 1.5% | 1.3% |
| Median | 1.4% | 1.1% |
| Interquartile 25% (IQ1) | 1.0% | 0.66% |
| Interquartile 75% (IQ3) | 1.8% | 1.6% |
| Interquartile Range (IQR) | 0.72% | 0.96% |
| Standard Deviation (Sample) | 0.67% | 0.84% |
| Standard Deviation (Population) | 0.67% | 0.83% |
Similar Demographics by Doctorate Degree
Demographics Similar to Colombians by Doctorate Degree
In terms of doctorate degree, the demographic groups most similar to Colombians are Immigrants from Western Africa (1.7%, a difference of 0.19%), Tongan (1.7%, a difference of 0.27%), Yugoslavian (1.7%, a difference of 0.28%), Immigrants from Armenia (1.7%, a difference of 0.29%), and Immigrants from South Eastern Asia (1.7%, a difference of 0.41%).
| Demographics | Rating | Rank | Doctorate Degree |
| Immigrants | Nigeria | 22.4 /100 | #201 | Fair 1.8% |
| Portuguese | 21.4 /100 | #202 | Fair 1.8% |
| Immigrants | Vietnam | 21.4 /100 | #203 | Fair 1.8% |
| Somalis | 21.2 /100 | #204 | Fair 1.7% |
| Venezuelans | 19.5 /100 | #205 | Poor 1.7% |
| Immigrants | Peru | 17.6 /100 | #206 | Poor 1.7% |
| Yugoslavians | 17.1 /100 | #207 | Poor 1.7% |
| Colombians | 16.1 /100 | #208 | Poor 1.7% |
| Immigrants | Western Africa | 15.4 /100 | #209 | Poor 1.7% |
| Tongans | 15.1 /100 | #210 | Poor 1.7% |
| Immigrants | Armenia | 15.1 /100 | #211 | Poor 1.7% |
| Immigrants | South Eastern Asia | 14.7 /100 | #212 | Poor 1.7% |
| Koreans | 14.2 /100 | #213 | Poor 1.7% |
| Pueblo | 14.2 /100 | #214 | Poor 1.7% |
| Alaskan Athabascans | 13.8 /100 | #215 | Poor 1.7% |
Demographics Similar to Immigrants from Barbados by Doctorate Degree
In terms of doctorate degree, the demographic groups most similar to Immigrants from Barbados are Immigrants from Trinidad and Tobago (1.5%, a difference of 0.090%), Sioux (1.5%, a difference of 0.11%), Yaqui (1.5%, a difference of 0.13%), Salvadoran (1.5%, a difference of 0.16%), and Crow (1.5%, a difference of 0.19%).
| Demographics | Rating | Rank | Doctorate Degree |
| Nicaraguans | 0.6 /100 | #265 | Tragic 1.5% |
| Immigrants | Liberia | 0.5 /100 | #266 | Tragic 1.5% |
| Kiowa | 0.5 /100 | #267 | Tragic 1.5% |
| U.S. Virgin Islanders | 0.5 /100 | #268 | Tragic 1.5% |
| Crow | 0.5 /100 | #269 | Tragic 1.5% |
| Salvadorans | 0.5 /100 | #270 | Tragic 1.5% |
| Immigrants | Trinidad and Tobago | 0.5 /100 | #271 | Tragic 1.5% |
| Immigrants | Barbados | 0.4 /100 | #272 | Tragic 1.5% |
| Sioux | 0.4 /100 | #273 | Tragic 1.5% |
| Yaqui | 0.4 /100 | #274 | Tragic 1.5% |
| Aleuts | 0.4 /100 | #275 | Tragic 1.5% |
| Paiute | 0.4 /100 | #276 | Tragic 1.5% |
| Bahamians | 0.4 /100 | #277 | Tragic 1.5% |
| Hawaiians | 0.4 /100 | #278 | Tragic 1.5% |
| Marshallese | 0.4 /100 | #279 | Tragic 1.5% |