Colombian vs Sierra Leonean Doctorate Degree
COMPARE
Colombian
Sierra Leonean
Doctorate Degree
Doctorate Degree Comparison
Colombians
Sierra Leoneans
1.7%
DOCTORATE DEGREE
16.1/ 100
METRIC RATING
208th/ 347
METRIC RANK
2.0%
DOCTORATE DEGREE
85.1/ 100
METRIC RATING
143rd/ 347
METRIC RANK
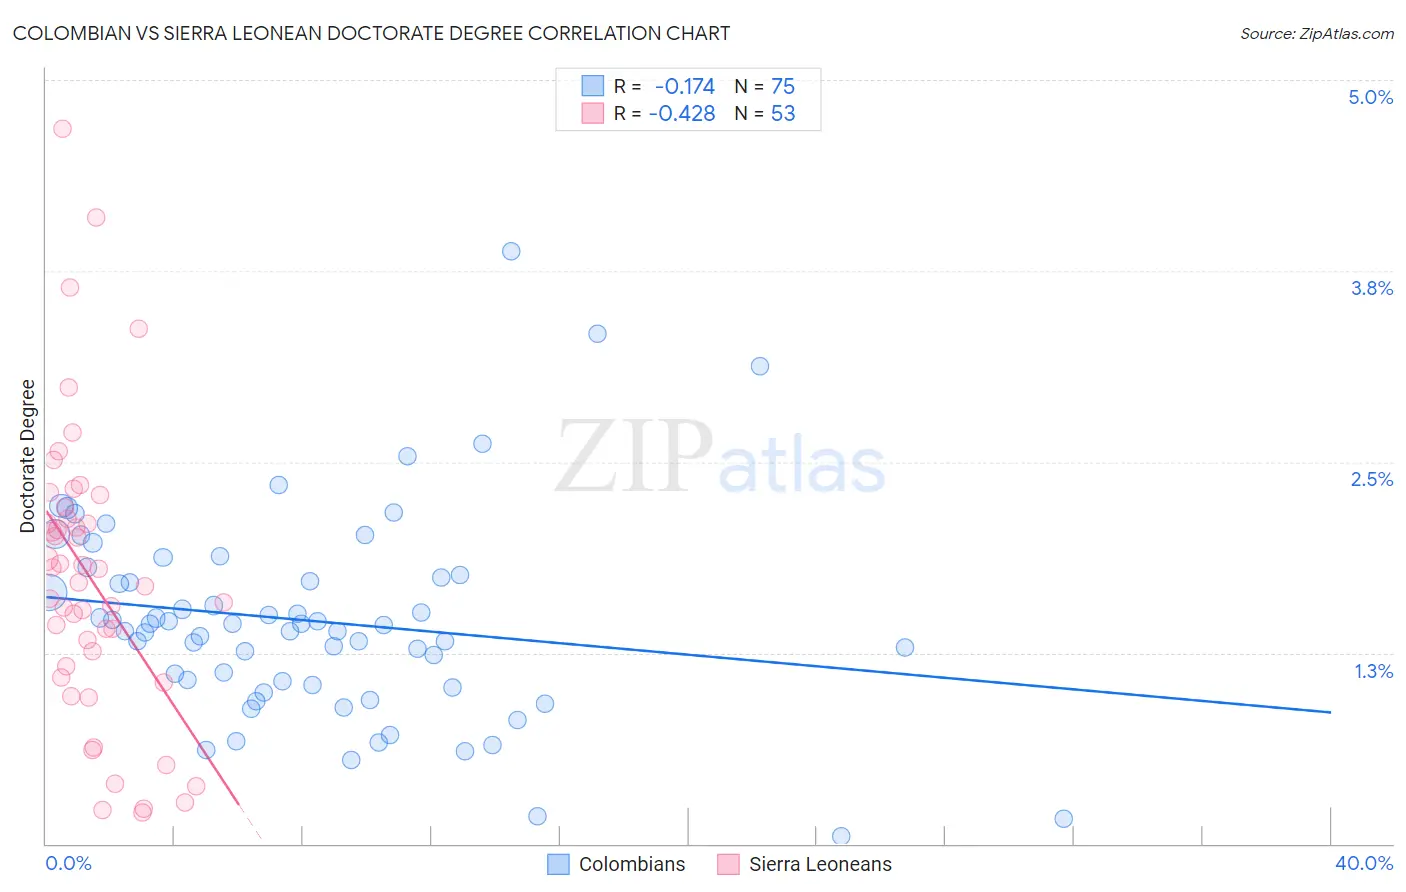
Colombian vs Sierra Leonean Doctorate Degree Correlation Chart
The statistical analysis conducted on geographies consisting of 415,824,999 people shows a poor negative correlation between the proportion of Colombians and percentage of population with at least doctorate degree education in the United States with a correlation coefficient (R) of -0.174 and weighted average of 1.7%. Similarly, the statistical analysis conducted on geographies consisting of 83,237,718 people shows a moderate negative correlation between the proportion of Sierra Leoneans and percentage of population with at least doctorate degree education in the United States with a correlation coefficient (R) of -0.428 and weighted average of 2.0%, a difference of 13.3%.
Doctorate Degree Correlation Summary
| Measurement | Colombian | Sierra Leonean |
| Minimum | 0.049% | 0.21% |
| Maximum | 3.9% | 4.7% |
| Range | 3.8% | 4.5% |
| Mean | 1.5% | 1.7% |
| Median | 1.4% | 1.7% |
| Interquartile 25% (IQ1) | 1.0% | 1.1% |
| Interquartile 75% (IQ3) | 1.8% | 2.2% |
| Interquartile Range (IQR) | 0.72% | 1.0% |
| Standard Deviation (Sample) | 0.67% | 0.95% |
| Standard Deviation (Population) | 0.67% | 0.94% |
Similar Demographics by Doctorate Degree
Demographics Similar to Colombians by Doctorate Degree
In terms of doctorate degree, the demographic groups most similar to Colombians are Immigrants from Western Africa (1.7%, a difference of 0.19%), Tongan (1.7%, a difference of 0.27%), Yugoslavian (1.7%, a difference of 0.28%), Immigrants from Armenia (1.7%, a difference of 0.29%), and Immigrants from South Eastern Asia (1.7%, a difference of 0.41%).
| Demographics | Rating | Rank | Doctorate Degree |
| Immigrants | Nigeria | 22.4 /100 | #201 | Fair 1.8% |
| Portuguese | 21.4 /100 | #202 | Fair 1.8% |
| Immigrants | Vietnam | 21.4 /100 | #203 | Fair 1.8% |
| Somalis | 21.2 /100 | #204 | Fair 1.7% |
| Venezuelans | 19.5 /100 | #205 | Poor 1.7% |
| Immigrants | Peru | 17.6 /100 | #206 | Poor 1.7% |
| Yugoslavians | 17.1 /100 | #207 | Poor 1.7% |
| Colombians | 16.1 /100 | #208 | Poor 1.7% |
| Immigrants | Western Africa | 15.4 /100 | #209 | Poor 1.7% |
| Tongans | 15.1 /100 | #210 | Poor 1.7% |
| Immigrants | Armenia | 15.1 /100 | #211 | Poor 1.7% |
| Immigrants | South Eastern Asia | 14.7 /100 | #212 | Poor 1.7% |
| Koreans | 14.2 /100 | #213 | Poor 1.7% |
| Pueblo | 14.2 /100 | #214 | Poor 1.7% |
| Alaskan Athabascans | 13.8 /100 | #215 | Poor 1.7% |
Demographics Similar to Sierra Leoneans by Doctorate Degree
In terms of doctorate degree, the demographic groups most similar to Sierra Leoneans are Immigrants from Moldova (2.0%, a difference of 0.21%), Italian (2.0%, a difference of 0.25%), Kenyan (1.9%, a difference of 0.39%), Immigrants from Syria (1.9%, a difference of 0.41%), and Senegalese (2.0%, a difference of 0.46%).
| Demographics | Rating | Rank | Doctorate Degree |
| Swedes | 88.3 /100 | #136 | Excellent 2.0% |
| South American Indians | 88.3 /100 | #137 | Excellent 2.0% |
| Swiss | 88.0 /100 | #138 | Excellent 2.0% |
| Afghans | 87.2 /100 | #139 | Excellent 2.0% |
| Immigrants | Africa | 87.0 /100 | #140 | Excellent 2.0% |
| Senegalese | 86.7 /100 | #141 | Excellent 2.0% |
| Italians | 86.0 /100 | #142 | Excellent 2.0% |
| Sierra Leoneans | 85.1 /100 | #143 | Excellent 2.0% |
| Immigrants | Moldova | 84.3 /100 | #144 | Excellent 2.0% |
| Kenyans | 83.6 /100 | #145 | Excellent 1.9% |
| Immigrants | Syria | 83.6 /100 | #146 | Excellent 1.9% |
| Immigrants | Senegal | 82.5 /100 | #147 | Excellent 1.9% |
| Luxembourgers | 81.1 /100 | #148 | Excellent 1.9% |
| Basques | 76.9 /100 | #149 | Good 1.9% |
| English | 75.9 /100 | #150 | Good 1.9% |