Cambodian vs Osage Associate's Degree
COMPARE
Cambodian
Osage
Associate's Degree
Associate's Degree Comparison
Cambodians
Osage
54.6%
ASSOCIATE'S DEGREE
100.0/ 100
METRIC RATING
20th/ 347
METRIC RANK
41.5%
ASSOCIATE'S DEGREE
0.3/ 100
METRIC RATING
264th/ 347
METRIC RANK
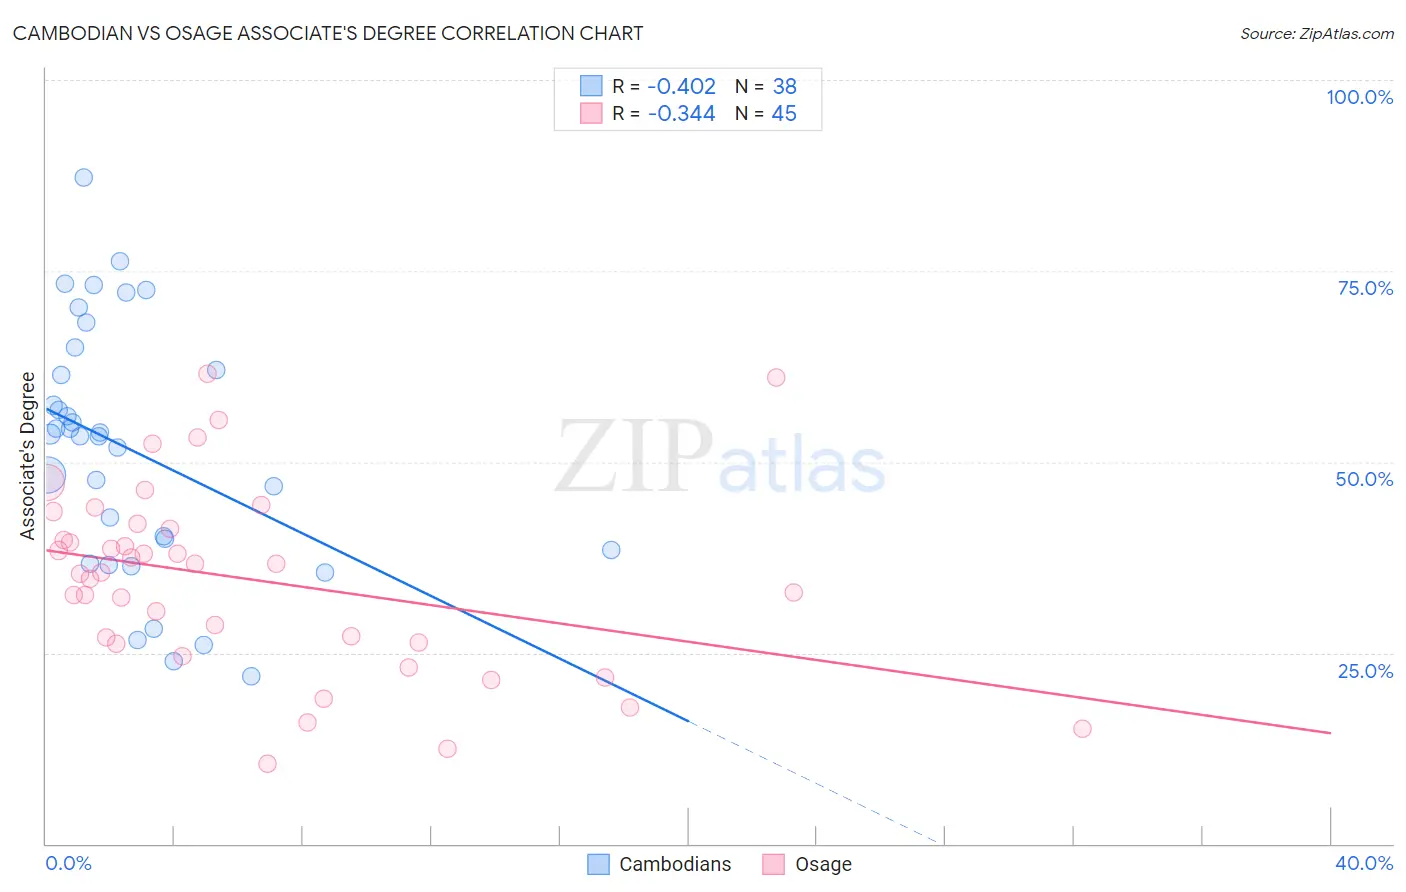
Cambodian vs Osage Associate's Degree Correlation Chart
The statistical analysis conducted on geographies consisting of 102,512,775 people shows a moderate negative correlation between the proportion of Cambodians and percentage of population with at least associate's degree education in the United States with a correlation coefficient (R) of -0.402 and weighted average of 54.6%. Similarly, the statistical analysis conducted on geographies consisting of 91,808,929 people shows a mild negative correlation between the proportion of Osage and percentage of population with at least associate's degree education in the United States with a correlation coefficient (R) of -0.344 and weighted average of 41.5%, a difference of 31.8%.
Associate's Degree Correlation Summary
| Measurement | Cambodian | Osage |
| Minimum | 21.9% | 10.4% |
| Maximum | 87.2% | 61.5% |
| Range | 65.4% | 51.1% |
| Mean | 51.5% | 34.6% |
| Median | 53.5% | 35.6% |
| Interquartile 25% (IQ1) | 38.4% | 26.3% |
| Interquartile 75% (IQ3) | 62.1% | 41.5% |
| Interquartile Range (IQR) | 23.7% | 15.3% |
| Standard Deviation (Sample) | 16.3% | 12.2% |
| Standard Deviation (Population) | 16.1% | 12.1% |
Similar Demographics by Associate's Degree
Demographics Similar to Cambodians by Associate's Degree
In terms of associate's degree, the demographic groups most similar to Cambodians are Immigrants from Ireland (54.7%, a difference of 0.020%), Immigrants from Sweden (54.6%, a difference of 0.060%), Immigrants from Japan (54.6%, a difference of 0.10%), Burmese (54.6%, a difference of 0.10%), and Immigrants from Korea (54.5%, a difference of 0.19%).
| Demographics | Rating | Rank | Associate's Degree |
| Immigrants | China | 100.0 /100 | #13 | Exceptional 55.5% |
| Immigrants | Hong Kong | 100.0 /100 | #14 | Exceptional 55.4% |
| Immigrants | Eastern Asia | 100.0 /100 | #15 | Exceptional 55.4% |
| Soviet Union | 100.0 /100 | #16 | Exceptional 55.1% |
| Eastern Europeans | 100.0 /100 | #17 | Exceptional 55.0% |
| Indians (Asian) | 100.0 /100 | #18 | Exceptional 54.8% |
| Immigrants | Ireland | 100.0 /100 | #19 | Exceptional 54.7% |
| Cambodians | 100.0 /100 | #20 | Exceptional 54.6% |
| Immigrants | Sweden | 100.0 /100 | #21 | Exceptional 54.6% |
| Immigrants | Japan | 100.0 /100 | #22 | Exceptional 54.6% |
| Burmese | 100.0 /100 | #23 | Exceptional 54.6% |
| Immigrants | Korea | 100.0 /100 | #24 | Exceptional 54.5% |
| Immigrants | Switzerland | 100.0 /100 | #25 | Exceptional 54.5% |
| Immigrants | Belgium | 100.0 /100 | #26 | Exceptional 54.5% |
| Latvians | 100.0 /100 | #27 | Exceptional 53.9% |
Demographics Similar to Osage by Associate's Degree
In terms of associate's degree, the demographic groups most similar to Osage are Immigrants from Jamaica (41.5%, a difference of 0.010%), Bahamian (41.5%, a difference of 0.030%), Nicaraguan (41.5%, a difference of 0.12%), Marshallese (41.6%, a difference of 0.25%), and Malaysian (41.6%, a difference of 0.44%).
| Demographics | Rating | Rank | Associate's Degree |
| Spanish Americans | 0.5 /100 | #257 | Tragic 41.8% |
| Japanese | 0.5 /100 | #258 | Tragic 41.7% |
| Malaysians | 0.4 /100 | #259 | Tragic 41.6% |
| Marshallese | 0.4 /100 | #260 | Tragic 41.6% |
| Nicaraguans | 0.4 /100 | #261 | Tragic 41.5% |
| Bahamians | 0.4 /100 | #262 | Tragic 41.5% |
| Immigrants | Jamaica | 0.3 /100 | #263 | Tragic 41.5% |
| Osage | 0.3 /100 | #264 | Tragic 41.5% |
| Africans | 0.2 /100 | #265 | Tragic 41.1% |
| Samoans | 0.2 /100 | #266 | Tragic 41.1% |
| Hawaiians | 0.2 /100 | #267 | Tragic 40.9% |
| Central American Indians | 0.2 /100 | #268 | Tragic 40.8% |
| Americans | 0.2 /100 | #269 | Tragic 40.8% |
| Chippewa | 0.2 /100 | #270 | Tragic 40.7% |
| Immigrants | Laos | 0.1 /100 | #271 | Tragic 40.7% |