Choctaw vs Pennsylvania German No Schooling Completed
COMPARE
Choctaw
Pennsylvania German
No Schooling Completed
No Schooling Completed Comparison
Choctaw
Pennsylvania Germans
1.8%
NO SCHOOLING COMPLETED
98.1/ 100
METRIC RATING
99th/ 347
METRIC RANK
1.5%
NO SCHOOLING COMPLETED
100.0/ 100
METRIC RATING
24th/ 347
METRIC RANK
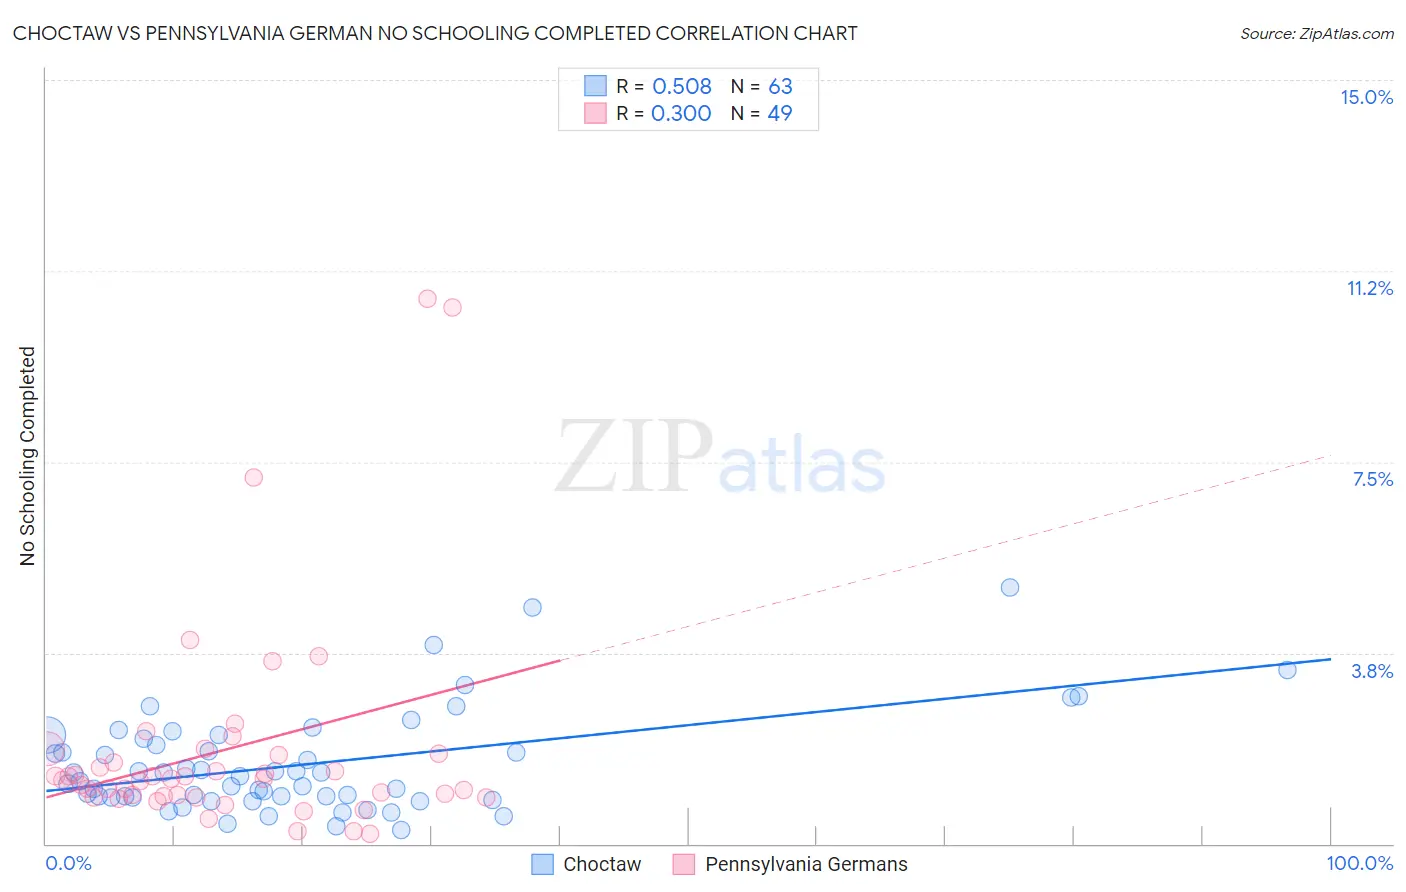
Choctaw vs Pennsylvania German No Schooling Completed Correlation Chart
The statistical analysis conducted on geographies consisting of 267,452,860 people shows a substantial positive correlation between the proportion of Choctaw and percentage of population with no schooling in the United States with a correlation coefficient (R) of 0.508 and weighted average of 1.8%. Similarly, the statistical analysis conducted on geographies consisting of 231,584,755 people shows a mild positive correlation between the proportion of Pennsylvania Germans and percentage of population with no schooling in the United States with a correlation coefficient (R) of 0.300 and weighted average of 1.5%, a difference of 22.2%.
No Schooling Completed Correlation Summary
| Measurement | Choctaw | Pennsylvania German |
| Minimum | 0.27% | 0.19% |
| Maximum | 5.0% | 10.7% |
| Range | 4.8% | 10.5% |
| Mean | 1.6% | 1.8% |
| Median | 1.3% | 1.3% |
| Interquartile 25% (IQ1) | 0.92% | 0.92% |
| Interquartile 75% (IQ3) | 2.1% | 1.8% |
| Interquartile Range (IQR) | 1.1% | 0.83% |
| Standard Deviation (Sample) | 0.99% | 2.2% |
| Standard Deviation (Population) | 0.98% | 2.1% |
Similar Demographics by No Schooling Completed
Demographics Similar to Choctaw by No Schooling Completed
In terms of no schooling completed, the demographic groups most similar to Choctaw are Iranian (1.8%, a difference of 0.19%), Immigrants from Singapore (1.8%, a difference of 0.20%), Immigrants from Ireland (1.8%, a difference of 0.47%), Immigrants from Czechoslovakia (1.8%, a difference of 0.49%), and Immigrants from Switzerland (1.8%, a difference of 0.50%).
| Demographics | Rating | Rank | No Schooling Completed |
| Romanians | 98.8 /100 | #92 | Exceptional 1.8% |
| Turks | 98.7 /100 | #93 | Exceptional 1.8% |
| Immigrants | Nonimmigrants | 98.5 /100 | #94 | Exceptional 1.8% |
| Puget Sound Salish | 98.5 /100 | #95 | Exceptional 1.8% |
| Bhutanese | 98.4 /100 | #96 | Exceptional 1.8% |
| Immigrants | Ireland | 98.4 /100 | #97 | Exceptional 1.8% |
| Iranians | 98.2 /100 | #98 | Exceptional 1.8% |
| Choctaw | 98.1 /100 | #99 | Exceptional 1.8% |
| Immigrants | Singapore | 98.0 /100 | #100 | Exceptional 1.8% |
| Immigrants | Czechoslovakia | 97.9 /100 | #101 | Exceptional 1.8% |
| Immigrants | Switzerland | 97.9 /100 | #102 | Exceptional 1.8% |
| Basques | 97.9 /100 | #103 | Exceptional 1.8% |
| Thais | 97.5 /100 | #104 | Exceptional 1.8% |
| German Russians | 97.5 /100 | #105 | Exceptional 1.8% |
| Immigrants | France | 97.3 /100 | #106 | Exceptional 1.8% |
Demographics Similar to Pennsylvania Germans by No Schooling Completed
In terms of no schooling completed, the demographic groups most similar to Pennsylvania Germans are French (1.5%, a difference of 0.020%), European (1.5%, a difference of 0.35%), Alaska Native (1.5%, a difference of 0.61%), Czech (1.5%, a difference of 0.61%), and Chinese (1.5%, a difference of 0.70%).
| Demographics | Rating | Rank | No Schooling Completed |
| Croatians | 100.0 /100 | #17 | Exceptional 1.5% |
| Danes | 100.0 /100 | #18 | Exceptional 1.5% |
| Alaskan Athabascans | 100.0 /100 | #19 | Exceptional 1.5% |
| Welsh | 100.0 /100 | #20 | Exceptional 1.5% |
| Chinese | 100.0 /100 | #21 | Exceptional 1.5% |
| Alaska Natives | 100.0 /100 | #22 | Exceptional 1.5% |
| Europeans | 100.0 /100 | #23 | Exceptional 1.5% |
| Pennsylvania Germans | 100.0 /100 | #24 | Exceptional 1.5% |
| French | 100.0 /100 | #25 | Exceptional 1.5% |
| Czechs | 100.0 /100 | #26 | Exceptional 1.5% |
| Scandinavians | 100.0 /100 | #27 | Exceptional 1.5% |
| French Canadians | 100.0 /100 | #28 | Exceptional 1.5% |
| Lumbee | 100.0 /100 | #29 | Exceptional 1.5% |
| British | 100.0 /100 | #30 | Exceptional 1.5% |
| Inupiat | 100.0 /100 | #31 | Exceptional 1.5% |