Chippewa vs Guamanian/Chamorro 2nd Grade
COMPARE
Chippewa
Guamanian/Chamorro
2nd Grade
2nd Grade Comparison
Chippewa
Guamanians/Chamorros
98.4%
2ND GRADE
99.9/ 100
METRIC RATING
39th/ 347
METRIC RANK
97.8%
2ND GRADE
25.7/ 100
METRIC RATING
198th/ 347
METRIC RANK
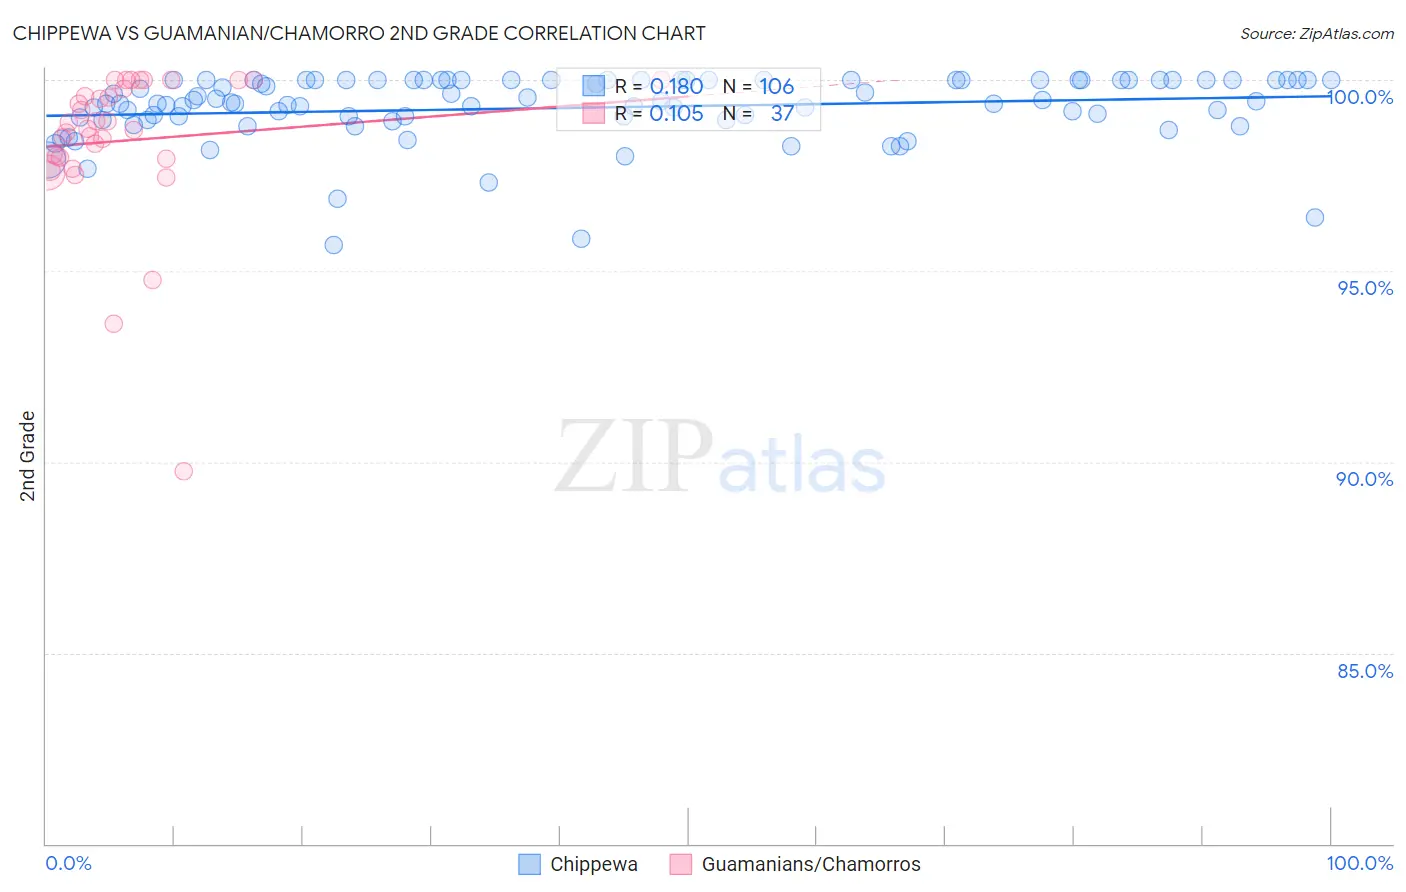
Chippewa vs Guamanian/Chamorro 2nd Grade Correlation Chart
The statistical analysis conducted on geographies consisting of 215,065,644 people shows a poor positive correlation between the proportion of Chippewa and percentage of population with at least 2nd grade education in the United States with a correlation coefficient (R) of 0.180 and weighted average of 98.4%. Similarly, the statistical analysis conducted on geographies consisting of 221,965,618 people shows a poor positive correlation between the proportion of Guamanians/Chamorros and percentage of population with at least 2nd grade education in the United States with a correlation coefficient (R) of 0.105 and weighted average of 97.8%, a difference of 0.66%.
2nd Grade Correlation Summary
| Measurement | Chippewa | Guamanian/Chamorro |
| Minimum | 95.7% | 89.7% |
| Maximum | 100.0% | 100.0% |
| Range | 4.3% | 10.3% |
| Mean | 99.3% | 98.4% |
| Median | 99.4% | 98.7% |
| Interquartile 25% (IQ1) | 99.0% | 97.9% |
| Interquartile 75% (IQ3) | 100.0% | 99.9% |
| Interquartile Range (IQR) | 1.0% | 1.9% |
| Standard Deviation (Sample) | 0.88% | 2.0% |
| Standard Deviation (Population) | 0.88% | 2.0% |
Similar Demographics by 2nd Grade
Demographics Similar to Chippewa by 2nd Grade
In terms of 2nd grade, the demographic groups most similar to Chippewa are Latvian (98.4%, a difference of 0.0%), Italian (98.4%, a difference of 0.010%), Luxembourger (98.4%, a difference of 0.010%), Eastern European (98.4%, a difference of 0.010%), and Native Hawaiian (98.4%, a difference of 0.020%).
| Demographics | Rating | Rank | 2nd Grade |
| French Canadians | 100.0 /100 | #32 | Exceptional 98.5% |
| Scandinavians | 100.0 /100 | #33 | Exceptional 98.5% |
| Chinese | 100.0 /100 | #34 | Exceptional 98.5% |
| Swiss | 100.0 /100 | #35 | Exceptional 98.5% |
| British | 100.0 /100 | #36 | Exceptional 98.5% |
| Italians | 99.9 /100 | #37 | Exceptional 98.4% |
| Latvians | 99.9 /100 | #38 | Exceptional 98.4% |
| Chippewa | 99.9 /100 | #39 | Exceptional 98.4% |
| Luxembourgers | 99.9 /100 | #40 | Exceptional 98.4% |
| Eastern Europeans | 99.9 /100 | #41 | Exceptional 98.4% |
| Native Hawaiians | 99.9 /100 | #42 | Exceptional 98.4% |
| Belgians | 99.9 /100 | #43 | Exceptional 98.4% |
| Northern Europeans | 99.9 /100 | #44 | Exceptional 98.4% |
| Hungarians | 99.9 /100 | #45 | Exceptional 98.4% |
| Lumbee | 99.9 /100 | #46 | Exceptional 98.4% |
Demographics Similar to Guamanians/Chamorros by 2nd Grade
In terms of 2nd grade, the demographic groups most similar to Guamanians/Chamorros are Mongolian (97.8%, a difference of 0.0%), Immigrants from Kenya (97.8%, a difference of 0.0%), Immigrants from Uganda (97.8%, a difference of 0.0%), Hawaiian (97.8%, a difference of 0.010%), and Paiute (97.8%, a difference of 0.010%).
| Demographics | Rating | Rank | 2nd Grade |
| Paraguayans | 30.8 /100 | #191 | Fair 97.8% |
| Blacks/African Americans | 29.9 /100 | #192 | Fair 97.8% |
| Hawaiians | 28.5 /100 | #193 | Fair 97.8% |
| Paiute | 27.0 /100 | #194 | Fair 97.8% |
| Mongolians | 26.7 /100 | #195 | Fair 97.8% |
| Immigrants | Kenya | 26.4 /100 | #196 | Fair 97.8% |
| Immigrants | Uganda | 26.3 /100 | #197 | Fair 97.8% |
| Guamanians/Chamorros | 25.7 /100 | #198 | Fair 97.8% |
| Immigrants | Egypt | 24.4 /100 | #199 | Fair 97.8% |
| Immigrants | Lebanon | 20.9 /100 | #200 | Fair 97.8% |
| Tohono O'odham | 20.9 /100 | #201 | Fair 97.8% |
| Immigrants | Ukraine | 20.5 /100 | #202 | Fair 97.8% |
| Yuman | 20.0 /100 | #203 | Fair 97.8% |
| Immigrants | Albania | 18.4 /100 | #204 | Poor 97.8% |
| Immigrants | Southern Europe | 18.1 /100 | #205 | Poor 97.8% |