Immigrants from Cambodia vs Kenyan 5th Grade
COMPARE
Immigrants from Cambodia
Kenyan
5th Grade
5th Grade Comparison
Immigrants from Cambodia
Kenyans
95.5%
5TH GRADE
0.0/ 100
METRIC RATING
326th/ 347
METRIC RANK
97.4%
5TH GRADE
59.7/ 100
METRIC RATING
161st/ 347
METRIC RANK
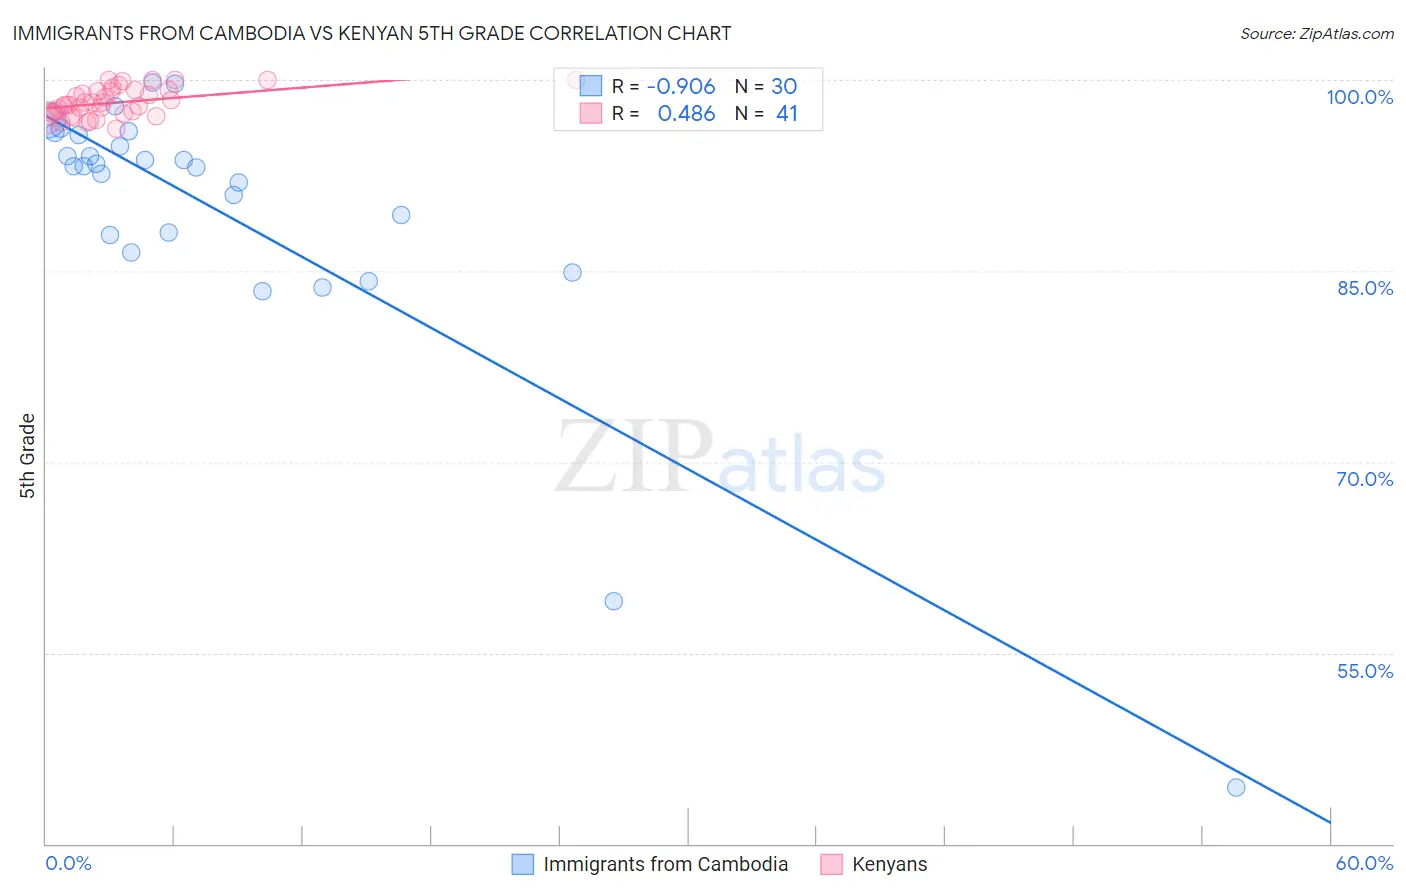
Immigrants from Cambodia vs Kenyan 5th Grade Correlation Chart
The statistical analysis conducted on geographies consisting of 205,153,442 people shows a near-perfect negative correlation between the proportion of Immigrants from Cambodia and percentage of population with at least 5th grade education in the United States with a correlation coefficient (R) of -0.906 and weighted average of 95.5%. Similarly, the statistical analysis conducted on geographies consisting of 168,244,042 people shows a moderate positive correlation between the proportion of Kenyans and percentage of population with at least 5th grade education in the United States with a correlation coefficient (R) of 0.486 and weighted average of 97.4%, a difference of 1.9%.
5th Grade Correlation Summary
| Measurement | Immigrants from Cambodia | Kenyan |
| Minimum | 44.4% | 96.2% |
| Maximum | 99.8% | 100.0% |
| Range | 55.4% | 3.8% |
| Mean | 89.6% | 98.2% |
| Median | 93.3% | 98.1% |
| Interquartile 25% (IQ1) | 87.8% | 97.3% |
| Interquartile 75% (IQ3) | 95.7% | 99.2% |
| Interquartile Range (IQR) | 7.9% | 1.9% |
| Standard Deviation (Sample) | 11.4% | 1.1% |
| Standard Deviation (Population) | 11.2% | 1.1% |
Similar Demographics by 5th Grade
Demographics Similar to Immigrants from Cambodia by 5th Grade
In terms of 5th grade, the demographic groups most similar to Immigrants from Cambodia are Dominican (95.5%, a difference of 0.0%), Honduran (95.6%, a difference of 0.030%), Hispanic or Latino (95.6%, a difference of 0.030%), Cape Verdean (95.5%, a difference of 0.030%), and Mexican American Indian (95.5%, a difference of 0.040%).
| Demographics | Rating | Rank | 5th Grade |
| Japanese | 0.0 /100 | #319 | Tragic 95.7% |
| Central American Indians | 0.0 /100 | #320 | Tragic 95.7% |
| Immigrants | Belize | 0.0 /100 | #321 | Tragic 95.7% |
| Immigrants | Nicaragua | 0.0 /100 | #322 | Tragic 95.6% |
| Immigrants | Fiji | 0.0 /100 | #323 | Tragic 95.6% |
| Hondurans | 0.0 /100 | #324 | Tragic 95.6% |
| Hispanics or Latinos | 0.0 /100 | #325 | Tragic 95.6% |
| Immigrants | Cambodia | 0.0 /100 | #326 | Tragic 95.5% |
| Dominicans | 0.0 /100 | #327 | Tragic 95.5% |
| Cape Verdeans | 0.0 /100 | #328 | Tragic 95.5% |
| Mexican American Indians | 0.0 /100 | #329 | Tragic 95.5% |
| Immigrants | Armenia | 0.0 /100 | #330 | Tragic 95.4% |
| Immigrants | Honduras | 0.0 /100 | #331 | Tragic 95.4% |
| Immigrants | Dominican Republic | 0.0 /100 | #332 | Tragic 95.3% |
| Immigrants | Latin America | 0.0 /100 | #333 | Tragic 95.3% |
Demographics Similar to Kenyans by 5th Grade
In terms of 5th grade, the demographic groups most similar to Kenyans are Immigrants from Iran (97.4%, a difference of 0.0%), Ugandan (97.4%, a difference of 0.0%), Bermudan (97.4%, a difference of 0.0%), Marshallese (97.4%, a difference of 0.010%), and Immigrants from Poland (97.4%, a difference of 0.010%).
| Demographics | Rating | Rank | 5th Grade |
| Immigrants | Russia | 71.2 /100 | #154 | Good 97.4% |
| Immigrants | Bosnia and Herzegovina | 71.0 /100 | #155 | Good 97.4% |
| French American Indians | 70.5 /100 | #156 | Good 97.4% |
| Immigrants | Jordan | 70.4 /100 | #157 | Good 97.4% |
| Albanians | 68.3 /100 | #158 | Good 97.4% |
| Immigrants | Italy | 65.2 /100 | #159 | Good 97.4% |
| Marshallese | 61.2 /100 | #160 | Good 97.4% |
| Kenyans | 59.7 /100 | #161 | Average 97.4% |
| Immigrants | Iran | 59.5 /100 | #162 | Average 97.4% |
| Ugandans | 58.9 /100 | #163 | Average 97.4% |
| Bermudans | 58.8 /100 | #164 | Average 97.4% |
| Immigrants | Poland | 57.9 /100 | #165 | Average 97.4% |
| Apache | 57.2 /100 | #166 | Average 97.4% |
| Immigrants | Belarus | 54.6 /100 | #167 | Average 97.3% |
| Chileans | 54.5 /100 | #168 | Average 97.3% |