New Zealander vs German Russian College, 1 year or more
COMPARE
New Zealander
German Russian
College, 1 year or more
College, 1 year or more Comparison
New Zealanders
German Russians
64.6%
COLLEGE, 1 YEAR OR MORE
99.9/ 100
METRIC RATING
49th/ 347
METRIC RANK
59.1%
COLLEGE, 1 YEAR OR MORE
39.3/ 100
METRIC RATING
183rd/ 347
METRIC RANK
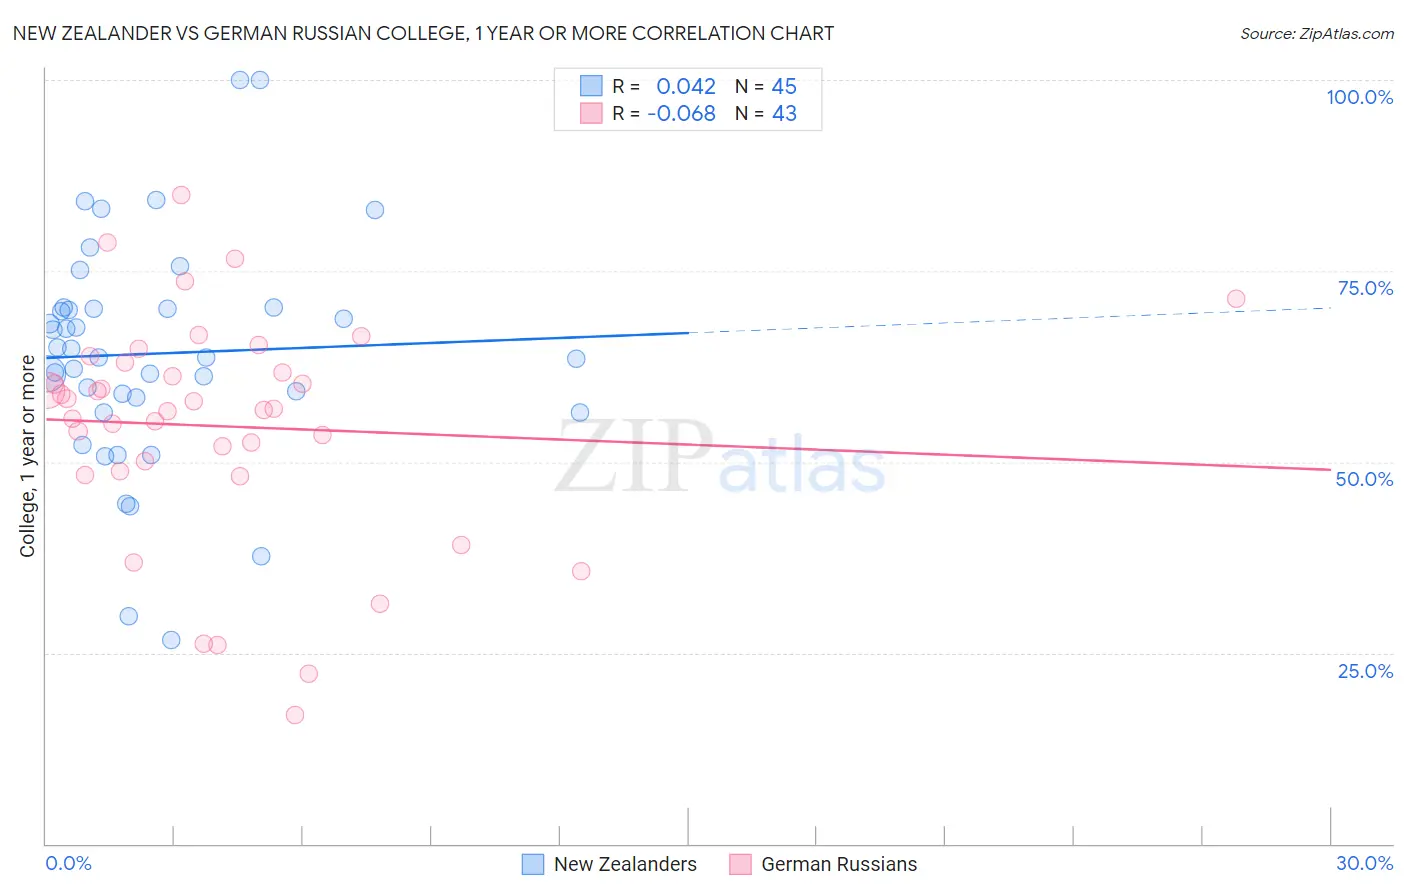
New Zealander vs German Russian College, 1 year or more Correlation Chart
The statistical analysis conducted on geographies consisting of 106,918,889 people shows no correlation between the proportion of New Zealanders and percentage of population with at least college, 1 year or more education in the United States with a correlation coefficient (R) of 0.042 and weighted average of 64.6%. Similarly, the statistical analysis conducted on geographies consisting of 96,461,984 people shows a slight negative correlation between the proportion of German Russians and percentage of population with at least college, 1 year or more education in the United States with a correlation coefficient (R) of -0.068 and weighted average of 59.1%, a difference of 9.3%.
College, 1 year or more Correlation Summary
| Measurement | New Zealander | German Russian |
| Minimum | 26.7% | 16.9% |
| Maximum | 100.0% | 84.9% |
| Range | 73.3% | 68.0% |
| Mean | 64.2% | 54.7% |
| Median | 63.6% | 57.0% |
| Interquartile 25% (IQ1) | 57.4% | 48.8% |
| Interquartile 75% (IQ3) | 70.1% | 63.0% |
| Interquartile Range (IQR) | 12.7% | 14.2% |
| Standard Deviation (Sample) | 14.9% | 14.9% |
| Standard Deviation (Population) | 14.8% | 14.7% |
Similar Demographics by College, 1 year or more
Demographics Similar to New Zealanders by College, 1 year or more
In terms of college, 1 year or more, the demographic groups most similar to New Zealanders are Immigrants from Bulgaria (64.6%, a difference of 0.040%), Bhutanese (64.6%, a difference of 0.070%), Australian (64.6%, a difference of 0.070%), Immigrants from Lithuania (64.6%, a difference of 0.080%), and Immigrants from Norway (64.7%, a difference of 0.25%).
| Demographics | Rating | Rank | College, 1 year or more |
| Immigrants | Latvia | 99.9 /100 | #42 | Exceptional 64.8% |
| Immigrants | Russia | 99.9 /100 | #43 | Exceptional 64.7% |
| Immigrants | Norway | 99.9 /100 | #44 | Exceptional 64.7% |
| Immigrants | Lithuania | 99.9 /100 | #45 | Exceptional 64.6% |
| Bhutanese | 99.9 /100 | #46 | Exceptional 64.6% |
| Australians | 99.9 /100 | #47 | Exceptional 64.6% |
| Immigrants | Bulgaria | 99.9 /100 | #48 | Exceptional 64.6% |
| New Zealanders | 99.9 /100 | #49 | Exceptional 64.6% |
| Immigrants | Austria | 99.8 /100 | #50 | Exceptional 64.4% |
| Immigrants | Malaysia | 99.8 /100 | #51 | Exceptional 64.3% |
| Immigrants | Netherlands | 99.8 /100 | #52 | Exceptional 64.2% |
| Asians | 99.8 /100 | #53 | Exceptional 64.2% |
| Zimbabweans | 99.8 /100 | #54 | Exceptional 64.2% |
| Immigrants | Belarus | 99.7 /100 | #55 | Exceptional 64.1% |
| Immigrants | Czechoslovakia | 99.7 /100 | #56 | Exceptional 64.1% |
Demographics Similar to German Russians by College, 1 year or more
In terms of college, 1 year or more, the demographic groups most similar to German Russians are Spaniard (59.0%, a difference of 0.060%), Immigrants from Bosnia and Herzegovina (59.2%, a difference of 0.19%), South American (59.0%, a difference of 0.20%), Swiss (59.2%, a difference of 0.22%), and Yugoslavian (59.2%, a difference of 0.26%).
| Demographics | Rating | Rank | College, 1 year or more |
| Immigrants | Poland | 48.9 /100 | #176 | Average 59.4% |
| Tlingit-Haida | 48.4 /100 | #177 | Average 59.4% |
| Czechoslovakians | 48.3 /100 | #178 | Average 59.4% |
| Bermudans | 46.6 /100 | #179 | Average 59.3% |
| Yugoslavians | 44.1 /100 | #180 | Average 59.2% |
| Swiss | 43.4 /100 | #181 | Average 59.2% |
| Immigrants | Bosnia and Herzegovina | 42.8 /100 | #182 | Average 59.2% |
| German Russians | 39.3 /100 | #183 | Fair 59.1% |
| Spaniards | 38.3 /100 | #184 | Fair 59.0% |
| South Americans | 35.9 /100 | #185 | Fair 59.0% |
| Scotch-Irish | 34.7 /100 | #186 | Fair 58.9% |
| Germans | 34.7 /100 | #187 | Fair 58.9% |
| French | 34.4 /100 | #188 | Fair 58.9% |
| Uruguayans | 31.8 /100 | #189 | Fair 58.8% |
| Immigrants | Cameroon | 31.2 /100 | #190 | Fair 58.8% |