Immigrants from Sudan vs Alsatian Professional Degree
COMPARE
Immigrants from Sudan
Alsatian
Professional Degree
Professional Degree Comparison
Immigrants from Sudan
Alsatians
4.9%
PROFESSIONAL DEGREE
95.4/ 100
METRIC RATING
119th/ 347
METRIC RANK
5.2%
PROFESSIONAL DEGREE
99.3/ 100
METRIC RATING
94th/ 347
METRIC RANK
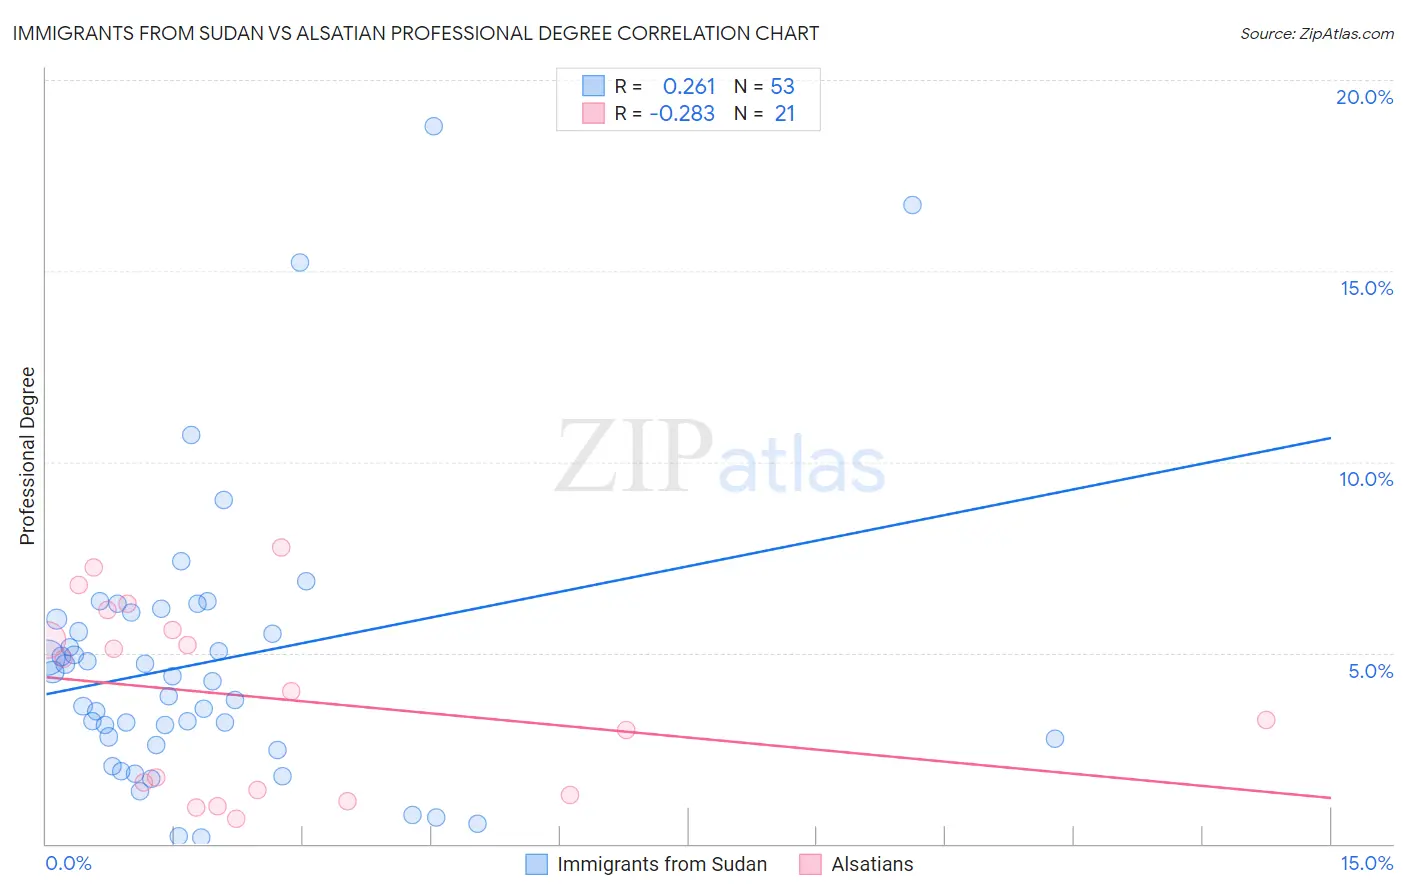
Immigrants from Sudan vs Alsatian Professional Degree Correlation Chart
The statistical analysis conducted on geographies consisting of 118,905,471 people shows a weak positive correlation between the proportion of Immigrants from Sudan and percentage of population with at least professional degree education in the United States with a correlation coefficient (R) of 0.261 and weighted average of 4.9%. Similarly, the statistical analysis conducted on geographies consisting of 82,635,637 people shows a weak negative correlation between the proportion of Alsatians and percentage of population with at least professional degree education in the United States with a correlation coefficient (R) of -0.283 and weighted average of 5.2%, a difference of 6.5%.
Professional Degree Correlation Summary
| Measurement | Immigrants from Sudan | Alsatian |
| Minimum | 0.17% | 0.66% |
| Maximum | 18.8% | 7.8% |
| Range | 18.6% | 7.1% |
| Mean | 4.8% | 3.8% |
| Median | 4.2% | 4.0% |
| Interquartile 25% (IQ1) | 2.7% | 1.4% |
| Interquartile 75% (IQ3) | 6.0% | 5.9% |
| Interquartile Range (IQR) | 3.3% | 4.5% |
| Standard Deviation (Sample) | 3.7% | 2.4% |
| Standard Deviation (Population) | 3.7% | 2.3% |
Similar Demographics by Professional Degree
Demographics Similar to Immigrants from Sudan by Professional Degree
In terms of professional degree, the demographic groups most similar to Immigrants from Sudan are Albanian (4.9%, a difference of 0.010%), Immigrants from Moldova (4.9%, a difference of 0.36%), Immigrants from Syria (4.9%, a difference of 0.54%), Croatian (4.9%, a difference of 0.54%), and Venezuelan (4.9%, a difference of 0.75%).
| Demographics | Rating | Rank | Professional Degree |
| Taiwanese | 97.3 /100 | #112 | Exceptional 5.0% |
| Immigrants | Pakistan | 97.2 /100 | #113 | Exceptional 5.0% |
| Immigrants | Morocco | 96.8 /100 | #114 | Exceptional 5.0% |
| Moroccans | 96.8 /100 | #115 | Exceptional 5.0% |
| Venezuelans | 96.3 /100 | #116 | Exceptional 4.9% |
| Immigrants | Syria | 96.0 /100 | #117 | Exceptional 4.9% |
| Croatians | 96.0 /100 | #118 | Exceptional 4.9% |
| Immigrants | Sudan | 95.4 /100 | #119 | Exceptional 4.9% |
| Albanians | 95.3 /100 | #120 | Exceptional 4.9% |
| Immigrants | Moldova | 94.8 /100 | #121 | Exceptional 4.9% |
| Immigrants | Germany | 94.1 /100 | #122 | Exceptional 4.9% |
| Immigrants | Venezuela | 93.8 /100 | #123 | Exceptional 4.8% |
| Immigrants | Eritrea | 93.5 /100 | #124 | Exceptional 4.8% |
| Immigrants | Albania | 93.3 /100 | #125 | Exceptional 4.8% |
| Europeans | 93.2 /100 | #126 | Exceptional 4.8% |
Demographics Similar to Alsatians by Professional Degree
In terms of professional degree, the demographic groups most similar to Alsatians are Northern European (5.2%, a difference of 0.020%), Zimbabwean (5.2%, a difference of 0.18%), Immigrants from Uzbekistan (5.2%, a difference of 0.59%), Immigrants from Eastern Europe (5.2%, a difference of 0.66%), and Laotian (5.2%, a difference of 0.70%).
| Demographics | Rating | Rank | Professional Degree |
| Immigrants | Chile | 99.5 /100 | #87 | Exceptional 5.3% |
| Egyptians | 99.5 /100 | #88 | Exceptional 5.3% |
| Chileans | 99.5 /100 | #89 | Exceptional 5.3% |
| Immigrants | Scotland | 99.5 /100 | #90 | Exceptional 5.3% |
| Laotians | 99.5 /100 | #91 | Exceptional 5.2% |
| Immigrants | Eastern Europe | 99.5 /100 | #92 | Exceptional 5.2% |
| Northern Europeans | 99.3 /100 | #93 | Exceptional 5.2% |
| Alsatians | 99.3 /100 | #94 | Exceptional 5.2% |
| Zimbabweans | 99.3 /100 | #95 | Exceptional 5.2% |
| Immigrants | Uzbekistan | 99.2 /100 | #96 | Exceptional 5.2% |
| Syrians | 99.1 /100 | #97 | Exceptional 5.2% |
| Austrians | 99.1 /100 | #98 | Exceptional 5.2% |
| Immigrants | Italy | 99.1 /100 | #99 | Exceptional 5.2% |
| Ugandans | 98.8 /100 | #100 | Exceptional 5.1% |
| Immigrants | Egypt | 98.5 /100 | #101 | Exceptional 5.1% |