Seminole vs Alsatian Professional Degree
COMPARE
Seminole
Alsatian
Professional Degree
Professional Degree Comparison
Seminole
Alsatians
3.2%
PROFESSIONAL DEGREE
0.1/ 100
METRIC RATING
320th/ 347
METRIC RANK
5.2%
PROFESSIONAL DEGREE
99.3/ 100
METRIC RATING
94th/ 347
METRIC RANK
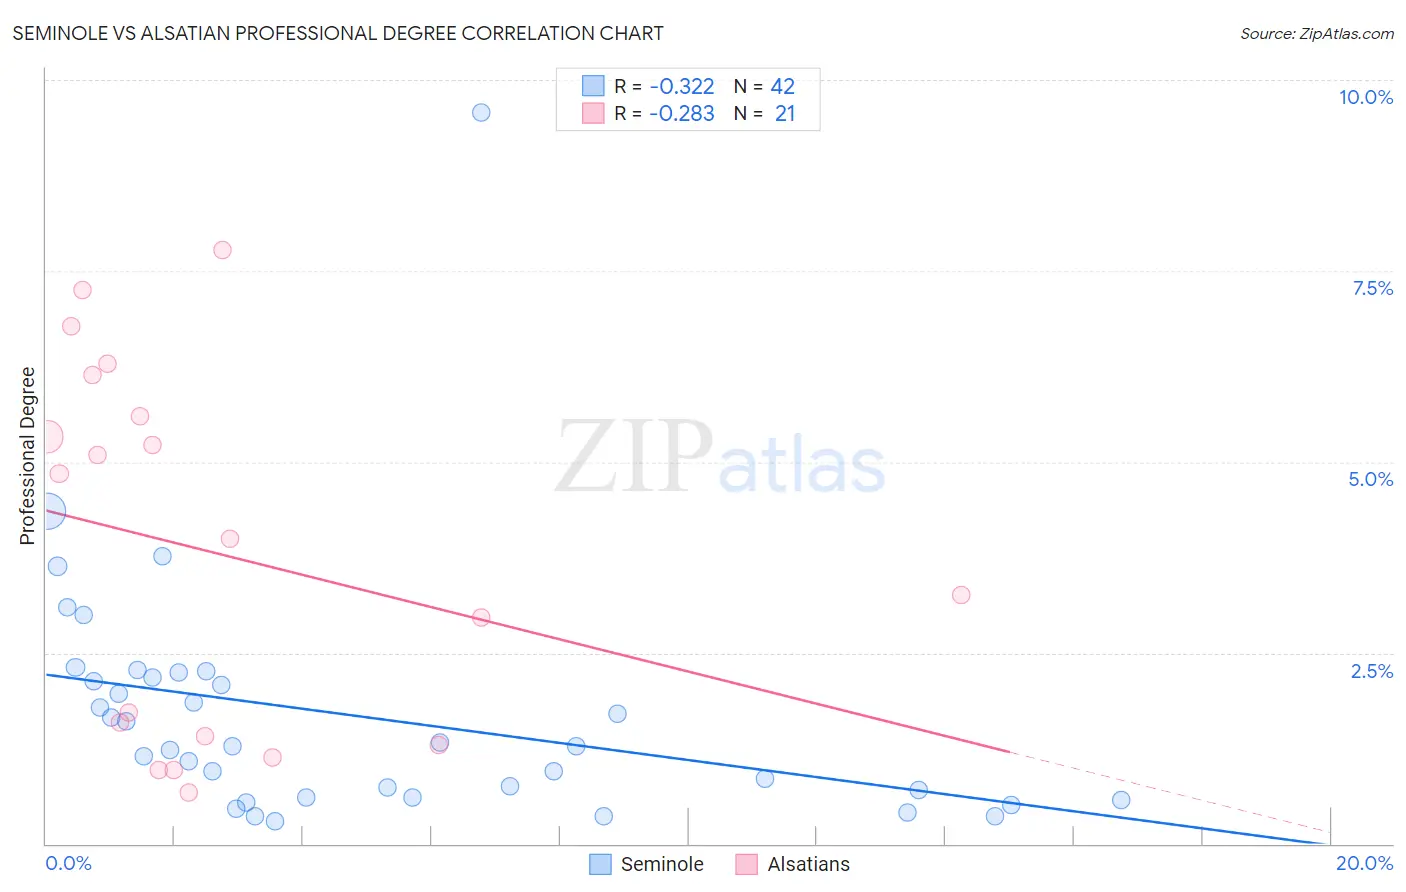
Seminole vs Alsatian Professional Degree Correlation Chart
The statistical analysis conducted on geographies consisting of 118,144,737 people shows a mild negative correlation between the proportion of Seminole and percentage of population with at least professional degree education in the United States with a correlation coefficient (R) of -0.322 and weighted average of 3.2%. Similarly, the statistical analysis conducted on geographies consisting of 82,635,637 people shows a weak negative correlation between the proportion of Alsatians and percentage of population with at least professional degree education in the United States with a correlation coefficient (R) of -0.283 and weighted average of 5.2%, a difference of 63.1%.
Professional Degree Correlation Summary
| Measurement | Seminole | Alsatian |
| Minimum | 0.30% | 0.66% |
| Maximum | 9.6% | 7.8% |
| Range | 9.3% | 7.1% |
| Mean | 1.7% | 3.8% |
| Median | 1.3% | 4.0% |
| Interquartile 25% (IQ1) | 0.61% | 1.4% |
| Interquartile 75% (IQ3) | 2.2% | 5.9% |
| Interquartile Range (IQR) | 1.6% | 4.5% |
| Standard Deviation (Sample) | 1.6% | 2.4% |
| Standard Deviation (Population) | 1.6% | 2.3% |
Similar Demographics by Professional Degree
Demographics Similar to Seminole by Professional Degree
In terms of professional degree, the demographic groups most similar to Seminole are Tsimshian (3.2%, a difference of 0.36%), Hispanic or Latino (3.2%, a difference of 0.72%), Inupiat (3.2%, a difference of 0.80%), Crow (3.2%, a difference of 1.1%), and Choctaw (3.2%, a difference of 1.1%).
| Demographics | Rating | Rank | Professional Degree |
| Yuman | 0.1 /100 | #313 | Tragic 3.3% |
| Mexican American Indians | 0.1 /100 | #314 | Tragic 3.3% |
| Immigrants | Laos | 0.1 /100 | #315 | Tragic 3.2% |
| Puerto Ricans | 0.1 /100 | #316 | Tragic 3.2% |
| Nepalese | 0.1 /100 | #317 | Tragic 3.2% |
| Immigrants | Micronesia | 0.1 /100 | #318 | Tragic 3.2% |
| Choctaw | 0.1 /100 | #319 | Tragic 3.2% |
| Seminole | 0.1 /100 | #320 | Tragic 3.2% |
| Tsimshian | 0.0 /100 | #321 | Tragic 3.2% |
| Hispanics or Latinos | 0.0 /100 | #322 | Tragic 3.2% |
| Inupiat | 0.0 /100 | #323 | Tragic 3.2% |
| Crow | 0.0 /100 | #324 | Tragic 3.2% |
| Yaqui | 0.0 /100 | #325 | Tragic 3.2% |
| Menominee | 0.0 /100 | #326 | Tragic 3.1% |
| Dutch West Indians | 0.0 /100 | #327 | Tragic 3.1% |
Demographics Similar to Alsatians by Professional Degree
In terms of professional degree, the demographic groups most similar to Alsatians are Northern European (5.2%, a difference of 0.020%), Zimbabwean (5.2%, a difference of 0.18%), Immigrants from Uzbekistan (5.2%, a difference of 0.59%), Immigrants from Eastern Europe (5.2%, a difference of 0.66%), and Laotian (5.2%, a difference of 0.70%).
| Demographics | Rating | Rank | Professional Degree |
| Immigrants | Chile | 99.5 /100 | #87 | Exceptional 5.3% |
| Egyptians | 99.5 /100 | #88 | Exceptional 5.3% |
| Chileans | 99.5 /100 | #89 | Exceptional 5.3% |
| Immigrants | Scotland | 99.5 /100 | #90 | Exceptional 5.3% |
| Laotians | 99.5 /100 | #91 | Exceptional 5.2% |
| Immigrants | Eastern Europe | 99.5 /100 | #92 | Exceptional 5.2% |
| Northern Europeans | 99.3 /100 | #93 | Exceptional 5.2% |
| Alsatians | 99.3 /100 | #94 | Exceptional 5.2% |
| Zimbabweans | 99.3 /100 | #95 | Exceptional 5.2% |
| Immigrants | Uzbekistan | 99.2 /100 | #96 | Exceptional 5.2% |
| Syrians | 99.1 /100 | #97 | Exceptional 5.2% |
| Austrians | 99.1 /100 | #98 | Exceptional 5.2% |
| Immigrants | Italy | 99.1 /100 | #99 | Exceptional 5.2% |
| Ugandans | 98.8 /100 | #100 | Exceptional 5.1% |
| Immigrants | Egypt | 98.5 /100 | #101 | Exceptional 5.1% |