Chippewa vs Alsatian Male Unemployment
COMPARE
Chippewa
Alsatian
Male Unemployment
Male Unemployment Comparison
Chippewa
Alsatians
6.6%
MALE UNEMPLOYMENT
0.0/ 100
METRIC RATING
297th/ 347
METRIC RANK
5.4%
MALE UNEMPLOYMENT
16.7/ 100
METRIC RATING
197th/ 347
METRIC RANK
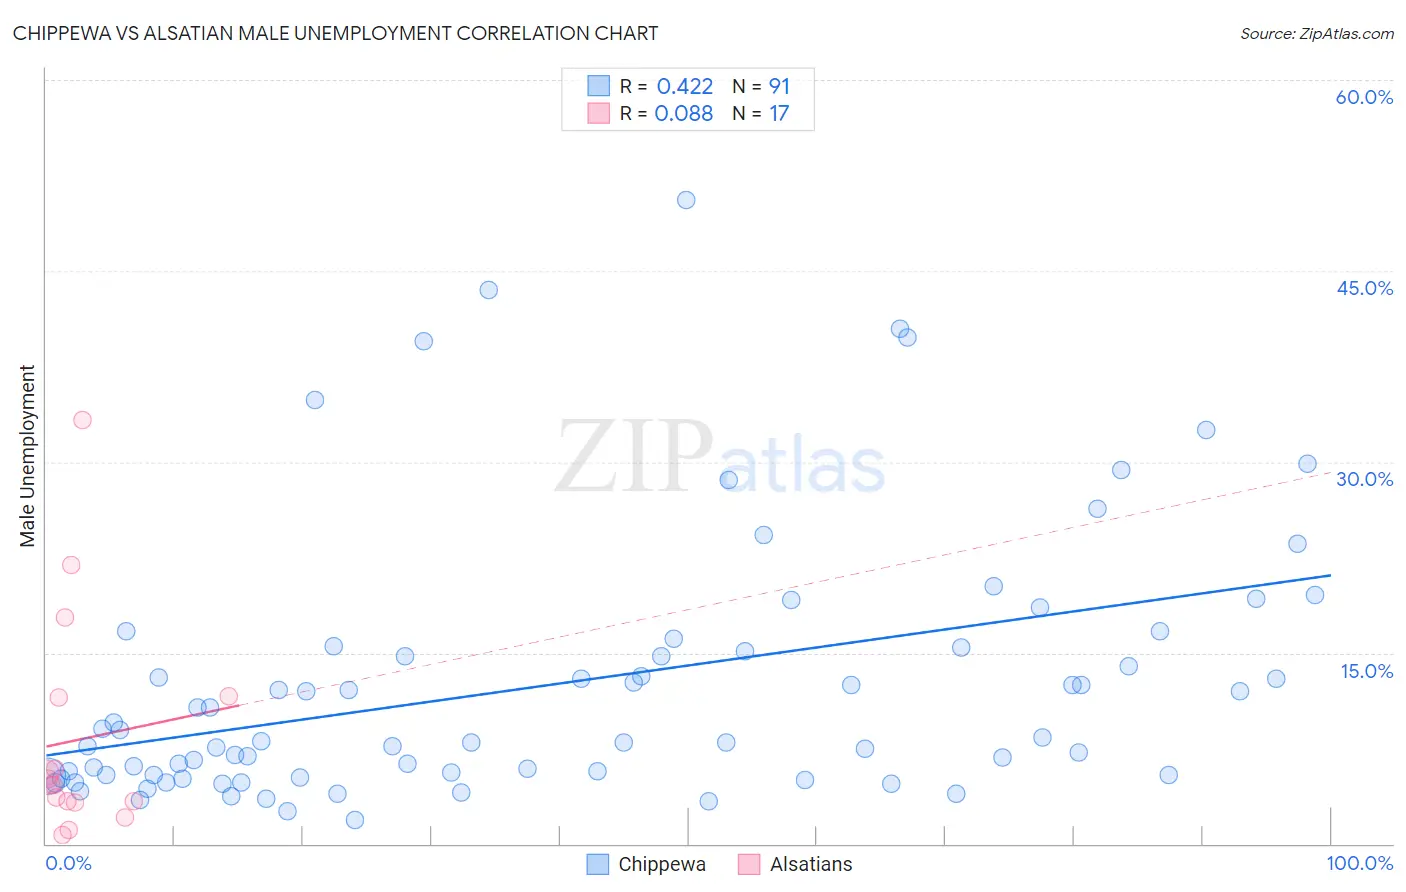
Chippewa vs Alsatian Male Unemployment Correlation Chart
The statistical analysis conducted on geographies consisting of 214,243,166 people shows a moderate positive correlation between the proportion of Chippewa and unemployment rate among males in the United States with a correlation coefficient (R) of 0.422 and weighted average of 6.6%. Similarly, the statistical analysis conducted on geographies consisting of 82,581,733 people shows a slight positive correlation between the proportion of Alsatians and unemployment rate among males in the United States with a correlation coefficient (R) of 0.088 and weighted average of 5.4%, a difference of 20.9%.
Male Unemployment Correlation Summary
| Measurement | Chippewa | Alsatian |
| Minimum | 1.9% | 0.70% |
| Maximum | 50.6% | 33.3% |
| Range | 48.7% | 32.6% |
| Mean | 12.5% | 8.2% |
| Median | 8.0% | 4.7% |
| Interquartile 25% (IQ1) | 5.4% | 3.3% |
| Interquartile 75% (IQ3) | 15.4% | 11.6% |
| Interquartile Range (IQR) | 10.0% | 8.3% |
| Standard Deviation (Sample) | 10.3% | 8.7% |
| Standard Deviation (Population) | 10.3% | 8.5% |
Similar Demographics by Male Unemployment
Demographics Similar to Chippewa by Male Unemployment
In terms of male unemployment, the demographic groups most similar to Chippewa are Jamaican (6.6%, a difference of 0.080%), Immigrants from Bangladesh (6.6%, a difference of 0.21%), Immigrants from Haiti (6.5%, a difference of 0.32%), Vietnamese (6.6%, a difference of 0.48%), and Immigrants from Belize (6.6%, a difference of 0.58%).
| Demographics | Rating | Rank | Male Unemployment |
| U.S. Virgin Islanders | 0.0 /100 | #290 | Tragic 6.4% |
| Immigrants | Azores | 0.0 /100 | #291 | Tragic 6.4% |
| Nepalese | 0.0 /100 | #292 | Tragic 6.4% |
| Haitians | 0.0 /100 | #293 | Tragic 6.4% |
| Senegalese | 0.0 /100 | #294 | Tragic 6.4% |
| Belizeans | 0.0 /100 | #295 | Tragic 6.5% |
| Immigrants | Haiti | 0.0 /100 | #296 | Tragic 6.5% |
| Chippewa | 0.0 /100 | #297 | Tragic 6.6% |
| Jamaicans | 0.0 /100 | #298 | Tragic 6.6% |
| Immigrants | Bangladesh | 0.0 /100 | #299 | Tragic 6.6% |
| Vietnamese | 0.0 /100 | #300 | Tragic 6.6% |
| Immigrants | Belize | 0.0 /100 | #301 | Tragic 6.6% |
| Ute | 0.0 /100 | #302 | Tragic 6.6% |
| Immigrants | West Indies | 0.0 /100 | #303 | Tragic 6.7% |
| West Indians | 0.0 /100 | #304 | Tragic 6.7% |
Demographics Similar to Alsatians by Male Unemployment
In terms of male unemployment, the demographic groups most similar to Alsatians are Albanian (5.4%, a difference of 0.060%), Immigrants from Southern Europe (5.4%, a difference of 0.10%), Immigrants from Thailand (5.4%, a difference of 0.22%), Immigrants from Greece (5.4%, a difference of 0.24%), and Spanish (5.4%, a difference of 0.28%).
| Demographics | Rating | Rank | Male Unemployment |
| Immigrants | Uganda | 28.8 /100 | #190 | Fair 5.4% |
| Immigrants | South Eastern Asia | 28.2 /100 | #191 | Fair 5.4% |
| Immigrants | Belarus | 26.0 /100 | #192 | Fair 5.4% |
| Immigrants | Israel | 25.2 /100 | #193 | Fair 5.4% |
| Spanish | 19.7 /100 | #194 | Poor 5.4% |
| Immigrants | Southern Europe | 17.7 /100 | #195 | Poor 5.4% |
| Albanians | 17.3 /100 | #196 | Poor 5.4% |
| Alsatians | 16.7 /100 | #197 | Poor 5.4% |
| Immigrants | Thailand | 14.7 /100 | #198 | Poor 5.4% |
| Immigrants | Greece | 14.5 /100 | #199 | Poor 5.4% |
| Immigrants | Zaire | 13.7 /100 | #200 | Poor 5.4% |
| Immigrants | Philippines | 13.5 /100 | #201 | Poor 5.4% |
| Immigrants | Nonimmigrants | 13.1 /100 | #202 | Poor 5.4% |
| Immigrants | Laos | 13.0 /100 | #203 | Poor 5.4% |
| Guamanians/Chamorros | 12.3 /100 | #204 | Poor 5.4% |