Chickasaw vs Immigrants from Sierra Leone 2nd Grade
COMPARE
Chickasaw
Immigrants from Sierra Leone
2nd Grade
2nd Grade Comparison
Chickasaw
Immigrants from Sierra Leone
98.3%
2ND GRADE
99.6/ 100
METRIC RATING
71st/ 347
METRIC RANK
97.4%
2ND GRADE
0.4/ 100
METRIC RATING
266th/ 347
METRIC RANK
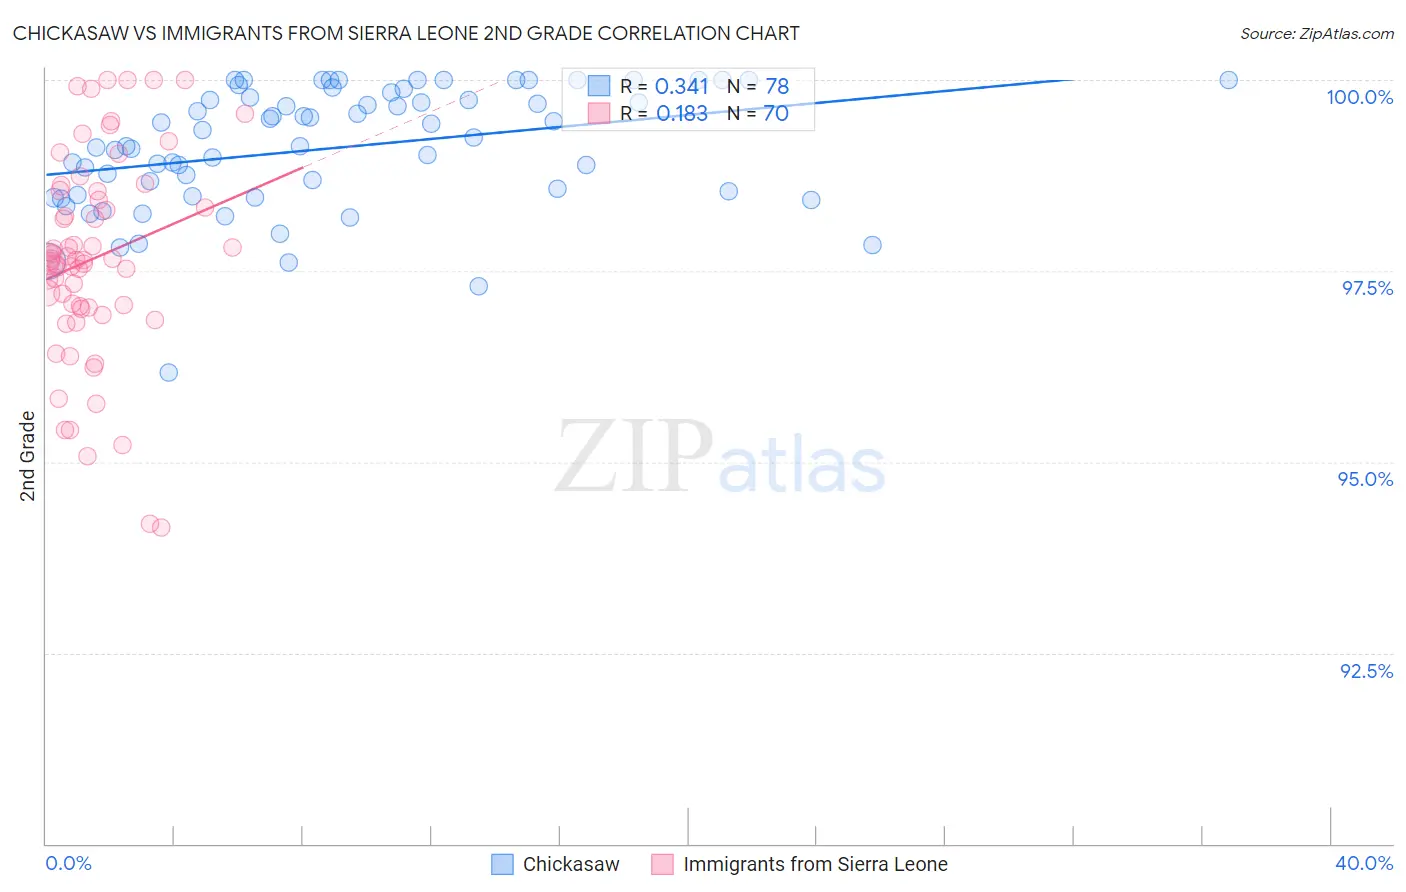
Chickasaw vs Immigrants from Sierra Leone 2nd Grade Correlation Chart
The statistical analysis conducted on geographies consisting of 147,725,311 people shows a mild positive correlation between the proportion of Chickasaw and percentage of population with at least 2nd grade education in the United States with a correlation coefficient (R) of 0.341 and weighted average of 98.3%. Similarly, the statistical analysis conducted on geographies consisting of 101,634,956 people shows a poor positive correlation between the proportion of Immigrants from Sierra Leone and percentage of population with at least 2nd grade education in the United States with a correlation coefficient (R) of 0.183 and weighted average of 97.4%, a difference of 0.89%.
2nd Grade Correlation Summary
| Measurement | Chickasaw | Immigrants from Sierra Leone |
| Minimum | 96.2% | 94.1% |
| Maximum | 100.0% | 100.0% |
| Range | 3.8% | 5.9% |
| Mean | 99.1% | 97.7% |
| Median | 99.2% | 97.6% |
| Interquartile 25% (IQ1) | 98.5% | 97.0% |
| Interquartile 75% (IQ3) | 99.8% | 98.5% |
| Interquartile Range (IQR) | 1.3% | 1.5% |
| Standard Deviation (Sample) | 0.81% | 1.3% |
| Standard Deviation (Population) | 0.80% | 1.3% |
Similar Demographics by 2nd Grade
Demographics Similar to Chickasaw by 2nd Grade
In terms of 2nd grade, the demographic groups most similar to Chickasaw are Immigrants from Austria (98.3%, a difference of 0.0%), Serbian (98.3%, a difference of 0.0%), Canadian (98.3%, a difference of 0.010%), Immigrants from Northern Europe (98.3%, a difference of 0.010%), and Russian (98.3%, a difference of 0.010%).
| Demographics | Rating | Rank | 2nd Grade |
| Immigrants | North America | 99.7 /100 | #64 | Exceptional 98.3% |
| New Zealanders | 99.7 /100 | #65 | Exceptional 98.3% |
| Canadians | 99.7 /100 | #66 | Exceptional 98.3% |
| Immigrants | Northern Europe | 99.7 /100 | #67 | Exceptional 98.3% |
| Russians | 99.7 /100 | #68 | Exceptional 98.3% |
| Immigrants | Austria | 99.6 /100 | #69 | Exceptional 98.3% |
| Serbians | 99.6 /100 | #70 | Exceptional 98.3% |
| Chickasaw | 99.6 /100 | #71 | Exceptional 98.3% |
| Cheyenne | 99.6 /100 | #72 | Exceptional 98.3% |
| Cajuns | 99.5 /100 | #73 | Exceptional 98.3% |
| Immigrants | Netherlands | 99.4 /100 | #74 | Exceptional 98.3% |
| Shoshone | 99.4 /100 | #75 | Exceptional 98.3% |
| Cherokee | 99.4 /100 | #76 | Exceptional 98.3% |
| Immigrants | England | 99.4 /100 | #77 | Exceptional 98.3% |
| Immigrants | Lithuania | 99.3 /100 | #78 | Exceptional 98.2% |
Demographics Similar to Immigrants from Sierra Leone by 2nd Grade
In terms of 2nd grade, the demographic groups most similar to Immigrants from Sierra Leone are Immigrants from Ethiopia (97.4%, a difference of 0.0%), Immigrants from Liberia (97.4%, a difference of 0.0%), Immigrants from South America (97.4%, a difference of 0.0%), Taiwanese (97.4%, a difference of 0.010%), and Fijian (97.5%, a difference of 0.020%).
| Demographics | Rating | Rank | 2nd Grade |
| Fijians | 0.5 /100 | #259 | Tragic 97.5% |
| Assyrians/Chaldeans/Syriacs | 0.5 /100 | #260 | Tragic 97.5% |
| Armenians | 0.5 /100 | #261 | Tragic 97.5% |
| Taiwanese | 0.4 /100 | #262 | Tragic 97.4% |
| Immigrants | Ethiopia | 0.4 /100 | #263 | Tragic 97.4% |
| Immigrants | Liberia | 0.4 /100 | #264 | Tragic 97.4% |
| Immigrants | South America | 0.4 /100 | #265 | Tragic 97.4% |
| Immigrants | Sierra Leone | 0.4 /100 | #266 | Tragic 97.4% |
| Cubans | 0.3 /100 | #267 | Tragic 97.4% |
| Immigrants | Nigeria | 0.3 /100 | #268 | Tragic 97.4% |
| West Indians | 0.3 /100 | #269 | Tragic 97.4% |
| Immigrants | Jamaica | 0.2 /100 | #270 | Tragic 97.4% |
| Immigrants | Cameroon | 0.2 /100 | #271 | Tragic 97.4% |
| Immigrants | Peru | 0.1 /100 | #272 | Tragic 97.4% |
| Immigrants | Bolivia | 0.1 /100 | #273 | Tragic 97.4% |