Chickasaw vs Immigrants from Sierra Leone Unemployment Among Seniors over 75 years
COMPARE
Chickasaw
Immigrants from Sierra Leone
Unemployment Among Seniors over 75 years
Unemployment Among Seniors over 75 years Comparison
Chickasaw
Immigrants from Sierra Leone
7.3%
UNEMPLOYMENT AMONG SENIORS OVER 75 YEARS
100.0/ 100
METRIC RATING
21st/ 347
METRIC RANK
8.5%
UNEMPLOYMENT AMONG SENIORS OVER 75 YEARS
85.6/ 100
METRIC RATING
147th/ 347
METRIC RANK
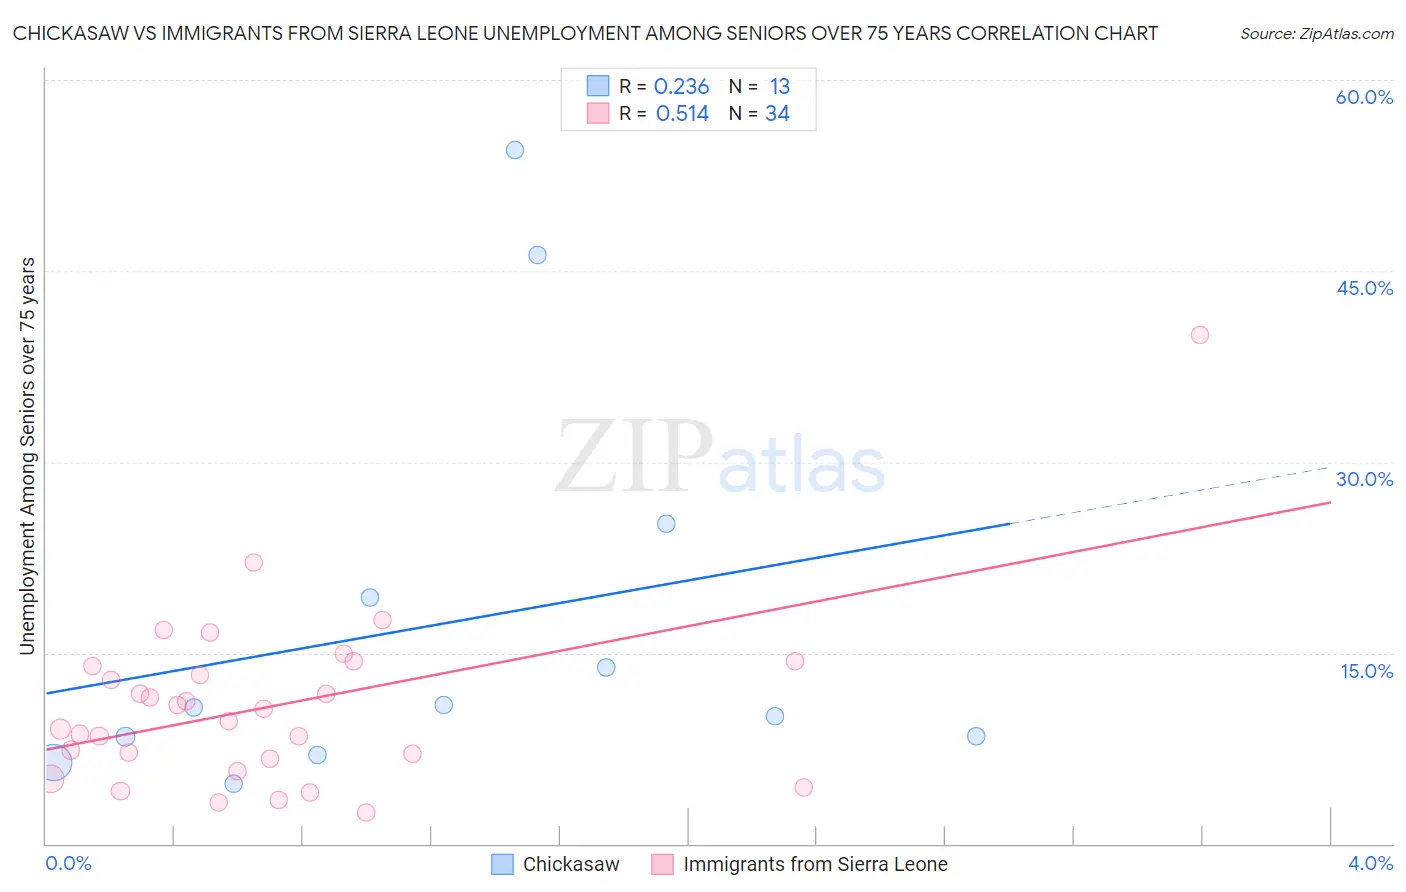
Chickasaw vs Immigrants from Sierra Leone Unemployment Among Seniors over 75 years Correlation Chart
The statistical analysis conducted on geographies consisting of 100,989,035 people shows a weak positive correlation between the proportion of Chickasaw and unemployment rate among seniors over the age of 75 in the United States with a correlation coefficient (R) of 0.236 and weighted average of 7.3%. Similarly, the statistical analysis conducted on geographies consisting of 73,581,651 people shows a substantial positive correlation between the proportion of Immigrants from Sierra Leone and unemployment rate among seniors over the age of 75 in the United States with a correlation coefficient (R) of 0.514 and weighted average of 8.5%, a difference of 16.2%.
Unemployment Among Seniors over 75 years Correlation Summary
| Measurement | Chickasaw | Immigrants from Sierra Leone |
| Minimum | 4.7% | 2.5% |
| Maximum | 54.5% | 40.0% |
| Range | 49.8% | 37.5% |
| Mean | 17.4% | 10.9% |
| Median | 10.7% | 10.1% |
| Interquartile 25% (IQ1) | 7.7% | 6.7% |
| Interquartile 75% (IQ3) | 22.2% | 14.0% |
| Interquartile Range (IQR) | 14.5% | 7.3% |
| Standard Deviation (Sample) | 15.8% | 7.0% |
| Standard Deviation (Population) | 15.1% | 6.9% |
Similar Demographics by Unemployment Among Seniors over 75 years
Demographics Similar to Chickasaw by Unemployment Among Seniors over 75 years
In terms of unemployment among seniors over 75 years, the demographic groups most similar to Chickasaw are Cypriot (7.4%, a difference of 0.76%), Israeli (7.4%, a difference of 1.1%), Immigrants from Cuba (7.4%, a difference of 1.2%), Armenian (7.2%, a difference of 1.4%), and Immigrants from Zaire (7.2%, a difference of 1.7%).
| Demographics | Rating | Rank | Unemployment Among Seniors over 75 years |
| Ute | 100.0 /100 | #14 | Exceptional 6.8% |
| Icelanders | 100.0 /100 | #15 | Exceptional 7.0% |
| Seminole | 100.0 /100 | #16 | Exceptional 7.1% |
| Immigrants | Switzerland | 100.0 /100 | #17 | Exceptional 7.2% |
| Immigrants | Uzbekistan | 100.0 /100 | #18 | Exceptional 7.2% |
| Immigrants | Zaire | 100.0 /100 | #19 | Exceptional 7.2% |
| Armenians | 100.0 /100 | #20 | Exceptional 7.2% |
| Chickasaw | 100.0 /100 | #21 | Exceptional 7.3% |
| Cypriots | 100.0 /100 | #22 | Exceptional 7.4% |
| Israelis | 100.0 /100 | #23 | Exceptional 7.4% |
| Immigrants | Cuba | 100.0 /100 | #24 | Exceptional 7.4% |
| Immigrants | Uruguay | 100.0 /100 | #25 | Exceptional 7.5% |
| South Africans | 100.0 /100 | #26 | Exceptional 7.5% |
| Immigrants | Barbados | 100.0 /100 | #27 | Exceptional 7.6% |
| Immigrants | Israel | 100.0 /100 | #28 | Exceptional 7.6% |
Demographics Similar to Immigrants from Sierra Leone by Unemployment Among Seniors over 75 years
In terms of unemployment among seniors over 75 years, the demographic groups most similar to Immigrants from Sierra Leone are Immigrants from Colombia (8.5%, a difference of 0.0%), Immigrants from South Eastern Asia (8.5%, a difference of 0.020%), Immigrants from Romania (8.5%, a difference of 0.070%), Immigrants from Ecuador (8.5%, a difference of 0.11%), and Colombian (8.5%, a difference of 0.13%).
| Demographics | Rating | Rank | Unemployment Among Seniors over 75 years |
| South Americans | 87.9 /100 | #140 | Excellent 8.5% |
| Immigrants | Bolivia | 87.9 /100 | #141 | Excellent 8.5% |
| Immigrants | Ukraine | 87.0 /100 | #142 | Excellent 8.5% |
| Immigrants | Costa Rica | 86.8 /100 | #143 | Excellent 8.5% |
| Colombians | 86.7 /100 | #144 | Excellent 8.5% |
| Immigrants | Romania | 86.2 /100 | #145 | Excellent 8.5% |
| Immigrants | South Eastern Asia | 85.8 /100 | #146 | Excellent 8.5% |
| Immigrants | Sierra Leone | 85.6 /100 | #147 | Excellent 8.5% |
| Immigrants | Colombia | 85.6 /100 | #148 | Excellent 8.5% |
| Immigrants | Ecuador | 84.6 /100 | #149 | Excellent 8.5% |
| Paiute | 82.5 /100 | #150 | Excellent 8.6% |
| Immigrants | Bosnia and Herzegovina | 80.6 /100 | #151 | Excellent 8.6% |
| Latvians | 80.5 /100 | #152 | Excellent 8.6% |
| Mongolians | 80.1 /100 | #153 | Excellent 8.6% |
| Immigrants | Pakistan | 79.7 /100 | #154 | Good 8.6% |