Chickasaw vs Immigrants from Bolivia 2nd Grade

COMPARE

Chickasaw
Race
Ancestry
AfghanAfricanAlaska NativeAlaskan AthabascanAlbanianAleutAlsatianAmericanApacheArabArapahoArgentineanArmenianAssyrian/Chaldean/SyriacAustralianAustrianBahamianBangladeshiBarbadianBasqueBelgianBelizeanBermudanBhutaneseBlackfeetBolivianBrazilianBritishBritish West IndianBulgarianBurmeseCajunCambodianCanadianCape VerdeanCarpatho RusynCelticCentral AmericanCentral American IndianCherokeeCheyenneChickasawChileanChineseChippewaChoctawColombianColvilleComancheCosta RicanCreeCreekCroatianCrowCubanCypriotCzechCzechoslovakianDanishDelawareDominicanDutchDutch West IndianEastern EuropeanEcuadorianEgyptianEnglishEstonianEthiopianEuropeanFijianFilipinoFinnishFrenchFrench American IndianFrench CanadianGermanGerman RussianGhanaianGreekGuamanian/ChamorroGuatemalanGuyaneseHaitianHmongHonduranHopiHoumaHungarianIcelanderIndian (Asian)IndonesianInupiatIranianIraqiIrishIroquoisIsraeliItalianJamaicanJapaneseJordanianKenyanKiowaKoreanLaotianLatvianLebaneseLiberianLithuanianLumbeeLuxembourgerMacedonianMalaysianMalteseMarshalleseMenomineeMexicanMexican American IndianMongolianMoroccanNative HawaiianNavajoNepaleseNew ZealanderNicaraguanNigerianNorthern EuropeanNorwegianOkinawanOsageOttawaPaiutePakistaniPalestinianPanamanianParaguayanPennsylvania GermanPeruvianPimaPolishPortuguesePotawatomiPuebloPuerto RicanPuget Sound SalishRomanianRussianSalvadoranSamoanScandinavianScotch-IrishScottishSeminoleSenegaleseSerbianShoshoneSierra LeoneanSiouxSlavicSlovakSloveneSomaliSouth AfricanSouth AmericanSouth American IndianSoviet UnionSpaniardSpanishSpanish AmericanSpanish American IndianSri LankanSubsaharan AfricanSudaneseSwedishSwissSyrianTaiwaneseThaiTlingit-HaidaTohono O'OdhamTonganTrinidadian and TobagonianTsimshianTurkishU.S. Virgin IslanderUgandanUkrainianUruguayanUteVenezuelanVietnameseWelshWest IndianYakamaYaquiYugoslavianYumanYup'ikZimbabwean
Immigration
NonimmigrantsImmigrantsAfghanistanAfricaAlbaniaArgentinaArmeniaAsiaAustraliaAustriaBahamasBangladeshBarbadosBelarusBelgiumBelizeBosnia and HerzegovinaBrazilBulgariaBurma/MyanmarCabo VerdeCambodiaCameroonCanadaCaribbeanCentral AmericaChileChinaColombiaCongoCosta RicaCroatiaCubaCzechoslovakiaDenmarkDominicaDominican RepublicEastern AfricaEastern AsiaEastern EuropeEcuadorEgyptEl SalvadorEnglandEritreaEthiopiaEuropeFijiFranceGermanyGhanaGreeceGrenadaGuatemalaGuyanaHaitiHondurasHong KongHungaryIndiaIndonesiaIranIraqIrelandIsraelItalyJamaicaJapanJordanKazakhstanKenyaKoreaKuwaitLaosLatin AmericaLatviaLebanonLiberiaLithuaniaMalaysiaMexicoMicronesiaMiddle AfricaMoldovaMoroccoNepalNetherlandsNicaraguaNigeriaNorth AmericaNorth MacedoniaNorthern AfricaNorthern EuropeNorwayOceaniaPakistanPanamaPeruPhilippinesPolandPortugalRomaniaRussiaSaudi ArabiaScotlandSenegalSerbiaSierra LeoneSingaporeSomaliaSouth AfricaSouth AmericaSouth Central AsiaSouth Eastern AsiaSouthern EuropeSpainSri LankaSt. Vincent and the GrenadinesSudanSwedenSwitzerlandSyriaTaiwanThailandTrinidad and TobagoTurkeyUgandaUkraineUruguayUzbekistanVenezuelaVietnamWest IndiesWestern AfricaWestern AsiaWestern EuropeYemenZaireZimbabweAzores
Immigrants from Bolivia
Race
Ancestry
AfghanAfricanAlaska NativeAlaskan AthabascanAlbanianAleutAlsatianAmericanApacheArabArapahoArgentineanArmenianAssyrian/Chaldean/SyriacAustralianAustrianBahamianBangladeshiBarbadianBasqueBelgianBelizeanBermudanBhutaneseBlackfeetBolivianBrazilianBritishBritish West IndianBulgarianBurmeseCajunCambodianCanadianCape VerdeanCarpatho RusynCelticCentral AmericanCentral American IndianCherokeeCheyenneChileanChineseChippewaChoctawColombianColvilleComancheCosta RicanCreeCreekCroatianCrowCubanCypriotCzechCzechoslovakianDanishDelawareDominicanDutchDutch West IndianEastern EuropeanEcuadorianEgyptianEnglishEstonianEthiopianEuropeanFijianFilipinoFinnishFrenchFrench American IndianFrench CanadianGermanGerman RussianGhanaianGreekGuamanian/ChamorroGuatemalanGuyaneseHaitianHmongHonduranHopiHoumaHungarianIcelanderIndian (Asian)IndonesianInupiatIranianIraqiIrishIroquoisIsraeliItalianJamaicanJapaneseJordanianKenyanKiowaKoreanLaotianLatvianLebaneseLiberianLithuanianLumbeeLuxembourgerMacedonianMalaysianMalteseMarshalleseMenomineeMexicanMexican American IndianMongolianMoroccanNative HawaiianNavajoNepaleseNew ZealanderNicaraguanNigerianNorthern EuropeanNorwegianOkinawanOsageOttawaPaiutePakistaniPalestinianPanamanianParaguayanPennsylvania GermanPeruvianPimaPolishPortuguesePotawatomiPuebloPuerto RicanPuget Sound SalishRomanianRussianSalvadoranSamoanScandinavianScotch-IrishScottishSeminoleSenegaleseSerbianShoshoneSierra LeoneanSiouxSlavicSlovakSloveneSomaliSouth AfricanSouth AmericanSouth American IndianSoviet UnionSpaniardSpanishSpanish AmericanSpanish American IndianSri LankanSubsaharan AfricanSudaneseSwedishSwissSyrianTaiwaneseThaiTlingit-HaidaTohono O'OdhamTonganTrinidadian and TobagonianTsimshianTurkishU.S. Virgin IslanderUgandanUkrainianUruguayanUteVenezuelanVietnameseWelshWest IndianYakamaYaquiYugoslavianYumanYup'ikZimbabwean
Immigration
NonimmigrantsImmigrantsAfghanistanAfricaAlbaniaArgentinaArmeniaAsiaAustraliaAustriaBahamasBangladeshBarbadosBelarusBelgiumBelizeBoliviaBosnia and HerzegovinaBrazilBulgariaBurma/MyanmarCabo VerdeCambodiaCameroonCanadaCaribbeanCentral AmericaChileChinaColombiaCongoCosta RicaCroatiaCubaCzechoslovakiaDenmarkDominicaDominican RepublicEastern AfricaEastern AsiaEastern EuropeEcuadorEgyptEl SalvadorEnglandEritreaEthiopiaEuropeFijiFranceGermanyGhanaGreeceGrenadaGuatemalaGuyanaHaitiHondurasHong KongHungaryIndiaIndonesiaIranIraqIrelandIsraelItalyJamaicaJapanJordanKazakhstanKenyaKoreaKuwaitLaosLatin AmericaLatviaLebanonLiberiaLithuaniaMalaysiaMexicoMicronesiaMiddle AfricaMoldovaMoroccoNepalNetherlandsNicaraguaNigeriaNorth AmericaNorth MacedoniaNorthern AfricaNorthern EuropeNorwayOceaniaPakistanPanamaPeruPhilippinesPolandPortugalRomaniaRussiaSaudi ArabiaScotlandSenegalSerbiaSierra LeoneSingaporeSomaliaSouth AfricaSouth AmericaSouth Central AsiaSouth Eastern AsiaSouthern EuropeSpainSri LankaSt. Vincent and the GrenadinesSudanSwedenSwitzerlandSyriaTaiwanThailandTrinidad and TobagoTurkeyUgandaUkraineUruguayUzbekistanVenezuelaVietnamWest IndiesWestern AfricaWestern AsiaWestern EuropeYemenZaireZimbabweAzores
2nd Grade
Income
Poverty
Unemployment
Labor Participation
Family Structure
Vehicle Availability
Education Level
Disability

2nd Grade Comparison

Chickasaw

Immigrants from Bolivia

Exceptional
Tragic
98.3%
2ND GRADE
99.6/ 100
METRIC RATING
71st/ 347
METRIC RANK
97.4%
2ND GRADE
0.1/ 100
METRIC RATING
273rd/ 347
METRIC RANK

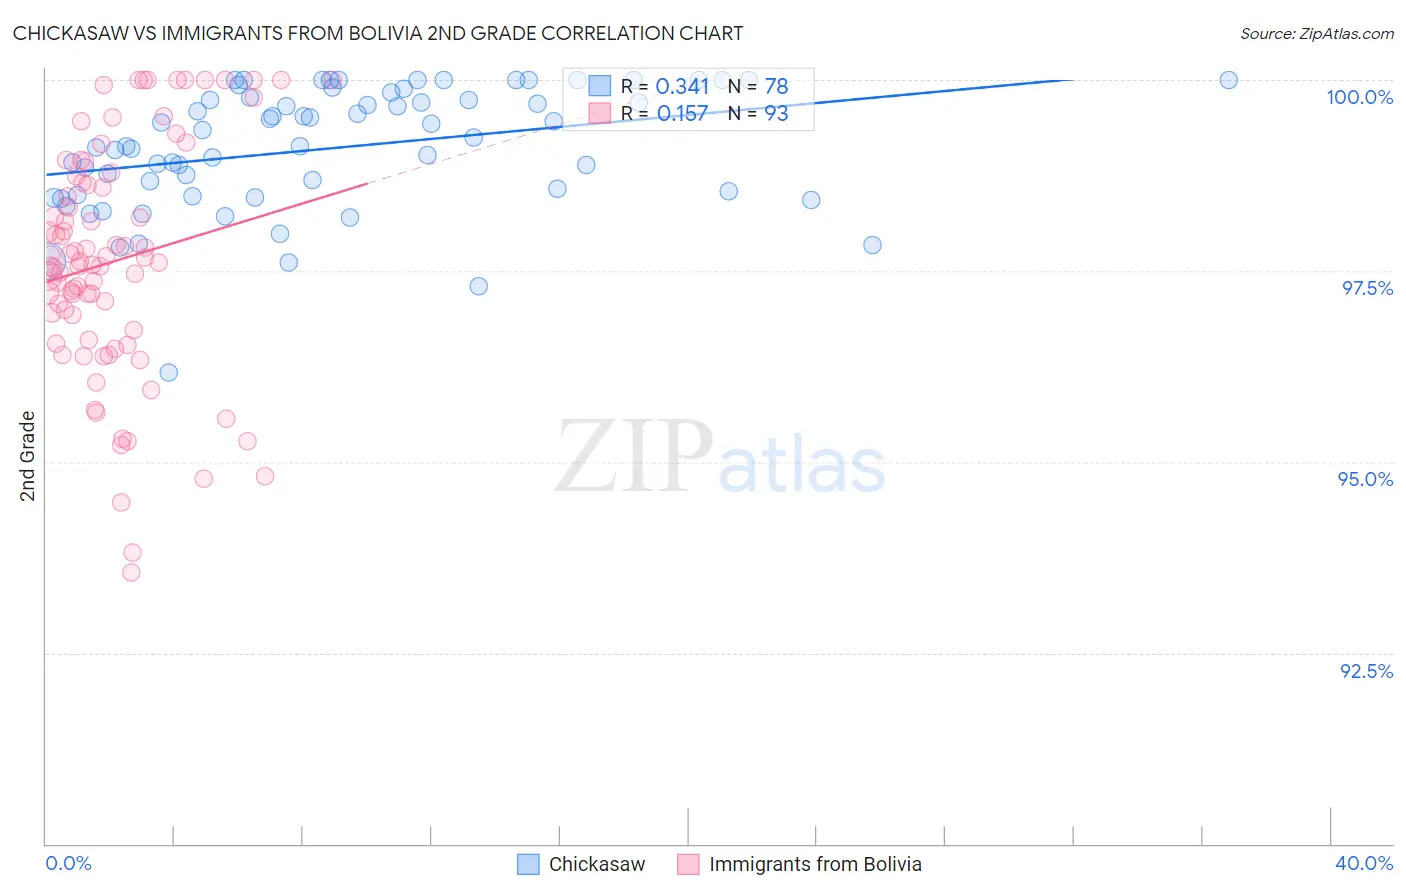
Chickasaw vs Immigrants from Bolivia 2nd Grade Correlation Chart

The statistical analysis conducted on geographies consisting of 147,725,311 people shows a mild positive correlation between the proportion of Chickasaw and percentage of population with at least 2nd grade education in the United States with a correlation coefficient (R) of 0.341 and weighted average of 98.3%. Similarly, the statistical analysis conducted on geographies consisting of 158,719,692 people shows a poor positive correlation between the proportion of Immigrants from Bolivia and percentage of population with at least 2nd grade education in the United States with a correlation coefficient (R) of 0.157 and weighted average of 97.4%, a difference of 0.97%.
Chickasaw vs Immigrants from Bolivia 2nd Grade

2nd Grade Correlation Summary

MeasurementChickasawImmigrants from Bolivia
Minimum96.2%93.6%
Maximum100.0%100.0%
Range3.8%6.4%
Mean99.1%97.6%
Median99.2%97.6%
Interquartile 25% (IQ1)98.5%96.7%
Interquartile 75% (IQ3)99.8%98.7%
Interquartile Range (IQR)1.3%2.0%
Standard Deviation (Sample)0.81%1.5%
Standard Deviation (Population)0.80%1.5%

Similar Demographics by 2nd Grade

Demographics Similar to Chickasaw by 2nd Grade

In terms of 2nd grade, the demographic groups most similar to Chickasaw are Immigrants from Austria (98.3%, a difference of 0.0%), Serbian (98.3%, a difference of 0.0%), Canadian (98.3%, a difference of 0.010%), Immigrants from Northern Europe (98.3%, a difference of 0.010%), and Russian (98.3%, a difference of 0.010%).
DemographicsRating | Rank2nd Grade
Immigrants | North America
99.7
/100
|
#64
Exceptional
98.3%
New Zealanders
99.7
/100
|
#65
Exceptional
98.3%
Canadians
99.7
/100
|
#66
Exceptional
98.3%
Immigrants | Northern Europe
99.7
/100
|
#67
Exceptional
98.3%
Russians
99.7
/100
|
#68
Exceptional
98.3%
Immigrants | Austria
99.6
/100
|
#69
Exceptional
98.3%
Serbians
99.6
/100
|
#70
Exceptional
98.3%
Chickasaw
99.6
/100
|
#71
Exceptional
98.3%
Cheyenne
99.6
/100
|
#72
Exceptional
98.3%
Cajuns
99.5
/100
|
#73
Exceptional
98.3%
Immigrants | Netherlands
99.4
/100
|
#74
Exceptional
98.3%
Shoshone
99.4
/100
|
#75
Exceptional
98.3%
Cherokee
99.4
/100
|
#76
Exceptional
98.3%
Immigrants | England
99.4
/100
|
#77
Exceptional
98.3%
Immigrants | Lithuania
99.3
/100
|
#78
Exceptional
98.2%

Demographics Similar to Immigrants from Bolivia by 2nd Grade

In terms of 2nd grade, the demographic groups most similar to Immigrants from Bolivia are Immigrants from Peru (97.4%, a difference of 0.010%), Ghanaian (97.4%, a difference of 0.010%), Immigrants from China (97.3%, a difference of 0.010%), Immigrants from Cameroon (97.4%, a difference of 0.020%), and Immigrants from Jamaica (97.4%, a difference of 0.040%).
DemographicsRating | Rank2nd Grade
Immigrants | Sierra Leone
0.4
/100
|
#266
Tragic
97.4%
Cubans
0.3
/100
|
#267
Tragic
97.4%
Immigrants | Nigeria
0.3
/100
|
#268
Tragic
97.4%
West Indians
0.3
/100
|
#269
Tragic
97.4%
Immigrants | Jamaica
0.2
/100
|
#270
Tragic
97.4%
Immigrants | Cameroon
0.2
/100
|
#271
Tragic
97.4%
Immigrants | Peru
0.1
/100
|
#272
Tragic
97.4%
Immigrants | Bolivia
0.1
/100
|
#273
Tragic
97.4%
Ghanaians
0.1
/100
|
#274
Tragic
97.4%
Immigrants | China
0.1
/100
|
#275
Tragic
97.3%
Immigrants | Philippines
0.1
/100
|
#276
Tragic
97.3%
Immigrants | Western Africa
0.1
/100
|
#277
Tragic
97.3%
Immigrants | Uzbekistan
0.1
/100
|
#278
Tragic
97.3%
Immigrants | Ghana
0.1
/100
|
#279
Tragic
97.3%
Afghans
0.1
/100
|
#280
Tragic
97.3%