Immigrants from Western Africa vs Immigrants from Sierra Leone 2nd Grade
COMPARE
Immigrants from Western Africa
Immigrants from Sierra Leone
2nd Grade
2nd Grade Comparison
Immigrants from Western Africa
Immigrants from Sierra Leone
97.3%
2ND GRADE
0.1/ 100
METRIC RATING
277th/ 347
METRIC RANK
97.4%
2ND GRADE
0.4/ 100
METRIC RATING
266th/ 347
METRIC RANK
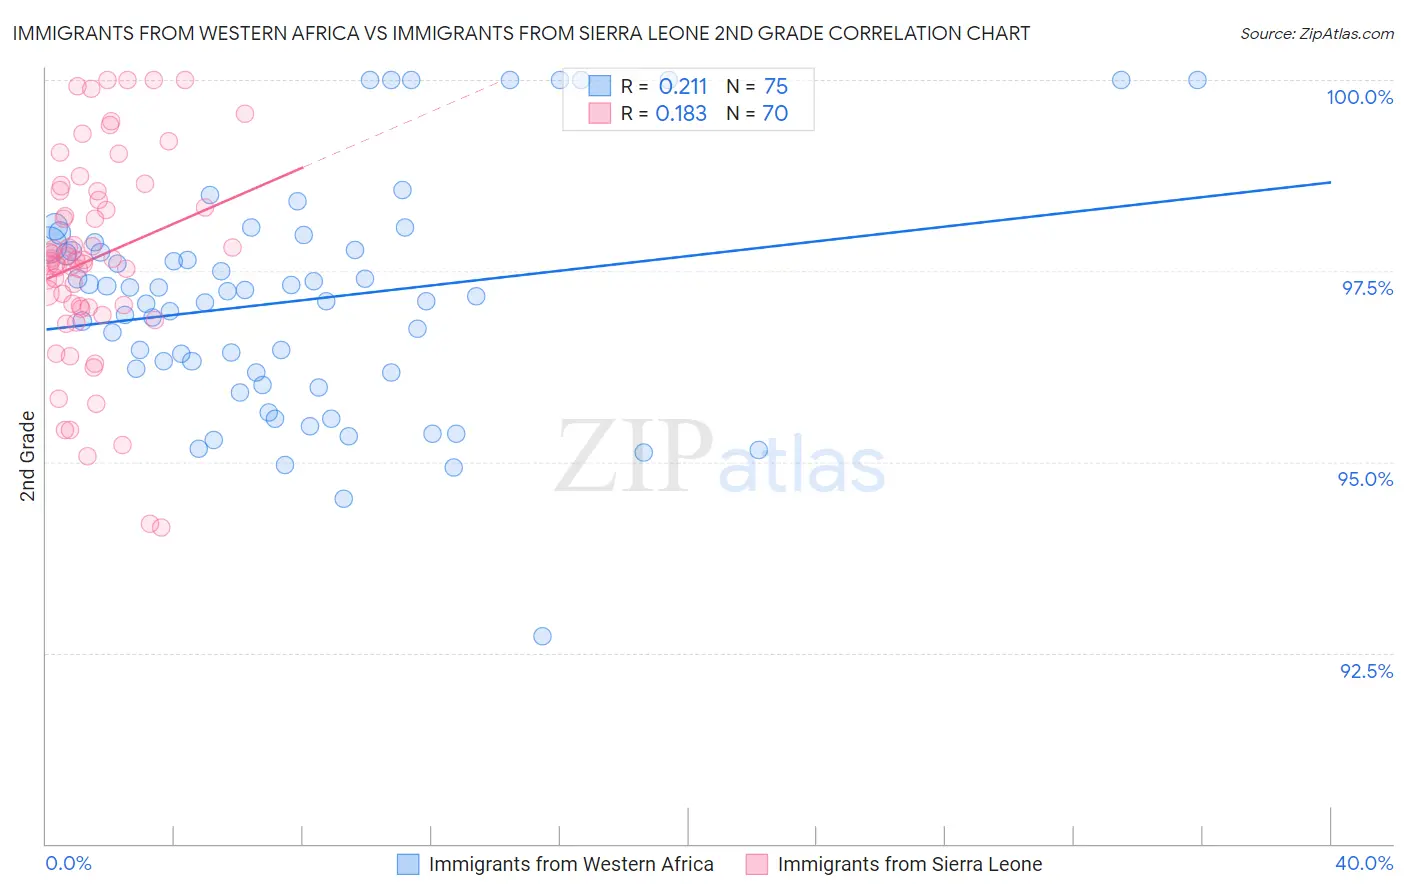
Immigrants from Western Africa vs Immigrants from Sierra Leone 2nd Grade Correlation Chart
The statistical analysis conducted on geographies consisting of 357,811,354 people shows a weak positive correlation between the proportion of Immigrants from Western Africa and percentage of population with at least 2nd grade education in the United States with a correlation coefficient (R) of 0.211 and weighted average of 97.3%. Similarly, the statistical analysis conducted on geographies consisting of 101,634,956 people shows a poor positive correlation between the proportion of Immigrants from Sierra Leone and percentage of population with at least 2nd grade education in the United States with a correlation coefficient (R) of 0.183 and weighted average of 97.4%, a difference of 0.12%.
2nd Grade Correlation Summary
| Measurement | Immigrants from Western Africa | Immigrants from Sierra Leone |
| Minimum | 92.7% | 94.1% |
| Maximum | 100.0% | 100.0% |
| Range | 7.3% | 5.9% |
| Mean | 97.1% | 97.7% |
| Median | 97.2% | 97.6% |
| Interquartile 25% (IQ1) | 96.2% | 97.0% |
| Interquartile 75% (IQ3) | 97.8% | 98.5% |
| Interquartile Range (IQR) | 1.7% | 1.5% |
| Standard Deviation (Sample) | 1.5% | 1.3% |
| Standard Deviation (Population) | 1.5% | 1.3% |
Demographics Similar to Immigrants from Western Africa and Immigrants from Sierra Leone by 2nd Grade
In terms of 2nd grade, the demographic groups most similar to Immigrants from Western Africa are Immigrants from Philippines (97.3%, a difference of 0.0%), Immigrants from Uzbekistan (97.3%, a difference of 0.010%), Immigrants from Ghana (97.3%, a difference of 0.020%), Afghan (97.3%, a difference of 0.020%), and Immigrants from China (97.3%, a difference of 0.030%). Similarly, the demographic groups most similar to Immigrants from Sierra Leone are Immigrants from Ethiopia (97.4%, a difference of 0.0%), Immigrants from Liberia (97.4%, a difference of 0.0%), Immigrants from South America (97.4%, a difference of 0.0%), Taiwanese (97.4%, a difference of 0.010%), and Armenian (97.5%, a difference of 0.020%).
| Demographics | Rating | Rank | 2nd Grade |
| Armenians | 0.5 /100 | #261 | Tragic 97.5% |
| Taiwanese | 0.4 /100 | #262 | Tragic 97.4% |
| Immigrants | Ethiopia | 0.4 /100 | #263 | Tragic 97.4% |
| Immigrants | Liberia | 0.4 /100 | #264 | Tragic 97.4% |
| Immigrants | South America | 0.4 /100 | #265 | Tragic 97.4% |
| Immigrants | Sierra Leone | 0.4 /100 | #266 | Tragic 97.4% |
| Cubans | 0.3 /100 | #267 | Tragic 97.4% |
| Immigrants | Nigeria | 0.3 /100 | #268 | Tragic 97.4% |
| West Indians | 0.3 /100 | #269 | Tragic 97.4% |
| Immigrants | Jamaica | 0.2 /100 | #270 | Tragic 97.4% |
| Immigrants | Cameroon | 0.2 /100 | #271 | Tragic 97.4% |
| Immigrants | Peru | 0.1 /100 | #272 | Tragic 97.4% |
| Immigrants | Bolivia | 0.1 /100 | #273 | Tragic 97.4% |
| Ghanaians | 0.1 /100 | #274 | Tragic 97.4% |
| Immigrants | China | 0.1 /100 | #275 | Tragic 97.3% |
| Immigrants | Philippines | 0.1 /100 | #276 | Tragic 97.3% |
| Immigrants | Western Africa | 0.1 /100 | #277 | Tragic 97.3% |
| Immigrants | Uzbekistan | 0.1 /100 | #278 | Tragic 97.3% |
| Immigrants | Ghana | 0.1 /100 | #279 | Tragic 97.3% |
| Afghans | 0.1 /100 | #280 | Tragic 97.3% |
| Trinidadians and Tobagonians | 0.1 /100 | #281 | Tragic 97.3% |