Chickasaw vs Immigrants from Denmark 2nd Grade
COMPARE
Chickasaw
Immigrants from Denmark
2nd Grade
2nd Grade Comparison
Chickasaw
Immigrants from Denmark
98.3%
2ND GRADE
99.6/ 100
METRIC RATING
71st/ 347
METRIC RANK
98.2%
2ND GRADE
99.0/ 100
METRIC RATING
87th/ 347
METRIC RANK
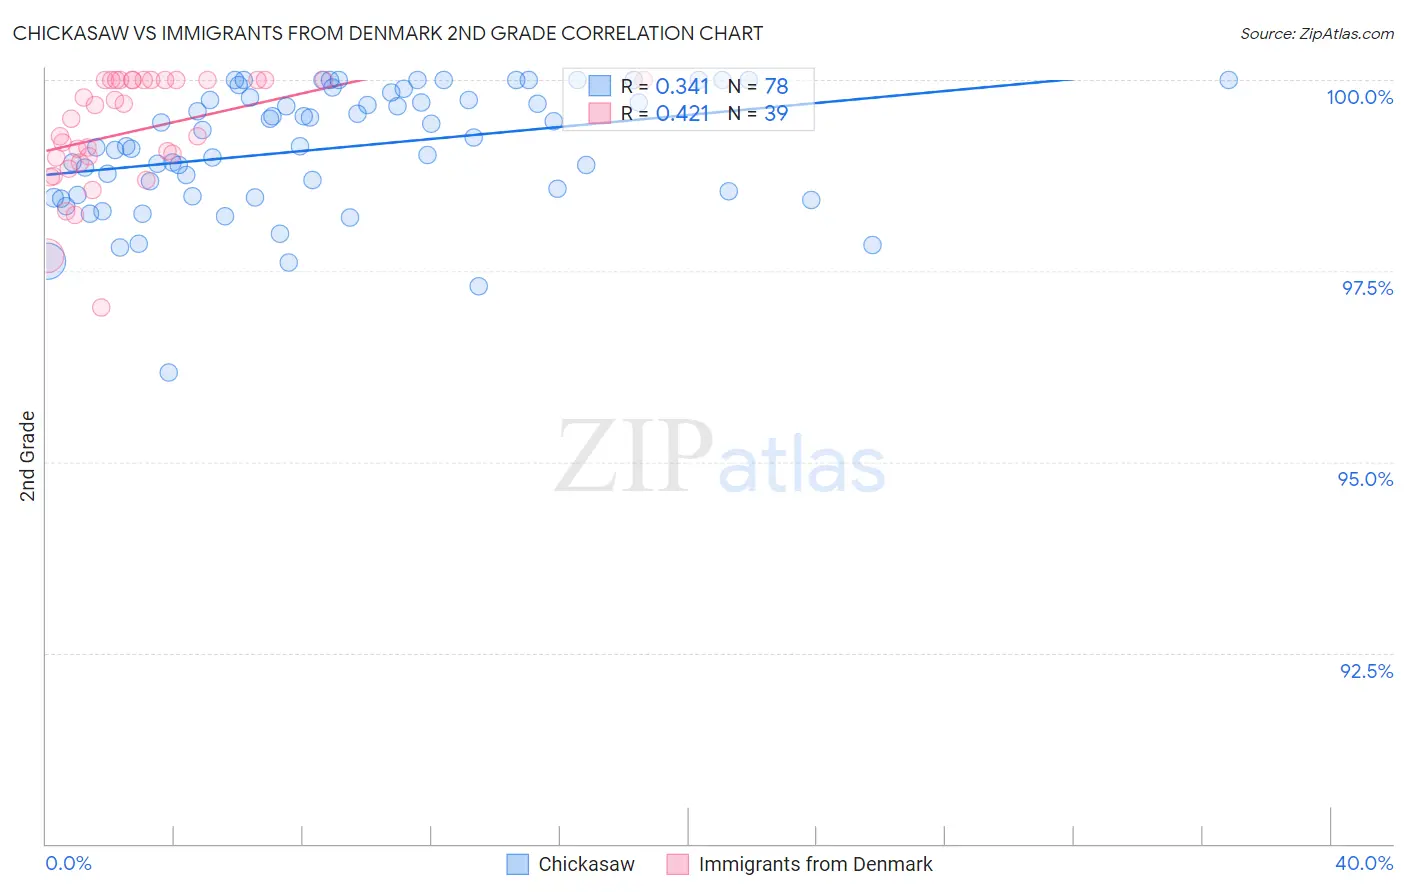
Chickasaw vs Immigrants from Denmark 2nd Grade Correlation Chart
The statistical analysis conducted on geographies consisting of 147,725,311 people shows a mild positive correlation between the proportion of Chickasaw and percentage of population with at least 2nd grade education in the United States with a correlation coefficient (R) of 0.341 and weighted average of 98.3%. Similarly, the statistical analysis conducted on geographies consisting of 136,428,049 people shows a moderate positive correlation between the proportion of Immigrants from Denmark and percentage of population with at least 2nd grade education in the United States with a correlation coefficient (R) of 0.421 and weighted average of 98.2%, a difference of 0.070%.
2nd Grade Correlation Summary
| Measurement | Chickasaw | Immigrants from Denmark |
| Minimum | 96.2% | 97.0% |
| Maximum | 100.0% | 100.0% |
| Range | 3.8% | 3.0% |
| Mean | 99.1% | 99.3% |
| Median | 99.2% | 99.5% |
| Interquartile 25% (IQ1) | 98.5% | 98.9% |
| Interquartile 75% (IQ3) | 99.8% | 100.0% |
| Interquartile Range (IQR) | 1.3% | 1.1% |
| Standard Deviation (Sample) | 0.81% | 0.73% |
| Standard Deviation (Population) | 0.80% | 0.72% |
Demographics Similar to Chickasaw and Immigrants from Denmark by 2nd Grade
In terms of 2nd grade, the demographic groups most similar to Chickasaw are Immigrants from Austria (98.3%, a difference of 0.0%), Serbian (98.3%, a difference of 0.0%), Cheyenne (98.3%, a difference of 0.010%), Cajun (98.3%, a difference of 0.010%), and Immigrants from Netherlands (98.3%, a difference of 0.030%). Similarly, the demographic groups most similar to Immigrants from Denmark are Potawatomi (98.2%, a difference of 0.0%), Immigrants from Australia (98.2%, a difference of 0.0%), Macedonian (98.2%, a difference of 0.0%), Icelander (98.2%, a difference of 0.010%), and Delaware (98.2%, a difference of 0.010%).
| Demographics | Rating | Rank | 2nd Grade |
| Immigrants | Austria | 99.6 /100 | #69 | Exceptional 98.3% |
| Serbians | 99.6 /100 | #70 | Exceptional 98.3% |
| Chickasaw | 99.6 /100 | #71 | Exceptional 98.3% |
| Cheyenne | 99.6 /100 | #72 | Exceptional 98.3% |
| Cajuns | 99.5 /100 | #73 | Exceptional 98.3% |
| Immigrants | Netherlands | 99.4 /100 | #74 | Exceptional 98.3% |
| Shoshone | 99.4 /100 | #75 | Exceptional 98.3% |
| Cherokee | 99.4 /100 | #76 | Exceptional 98.3% |
| Immigrants | England | 99.4 /100 | #77 | Exceptional 98.3% |
| Immigrants | Lithuania | 99.3 /100 | #78 | Exceptional 98.2% |
| Immigrants | Belgium | 99.3 /100 | #79 | Exceptional 98.2% |
| Osage | 99.2 /100 | #80 | Exceptional 98.2% |
| Icelanders | 99.2 /100 | #81 | Exceptional 98.2% |
| Delaware | 99.1 /100 | #82 | Exceptional 98.2% |
| Immigrants | Sweden | 99.1 /100 | #83 | Exceptional 98.2% |
| Hopi | 99.1 /100 | #84 | Exceptional 98.2% |
| Potawatomi | 99.1 /100 | #85 | Exceptional 98.2% |
| Immigrants | Australia | 99.0 /100 | #86 | Exceptional 98.2% |
| Immigrants | Denmark | 99.0 /100 | #87 | Exceptional 98.2% |
| Macedonians | 99.0 /100 | #88 | Exceptional 98.2% |
| Ukrainians | 98.9 /100 | #89 | Exceptional 98.2% |