Pennsylvania German vs Immigrants from Sierra Leone 2nd Grade
COMPARE
Pennsylvania German
Immigrants from Sierra Leone
2nd Grade
2nd Grade Comparison
Pennsylvania Germans
Immigrants from Sierra Leone
98.5%
2ND GRADE
100.0/ 100
METRIC RATING
24th/ 347
METRIC RANK
97.4%
2ND GRADE
0.4/ 100
METRIC RATING
266th/ 347
METRIC RANK
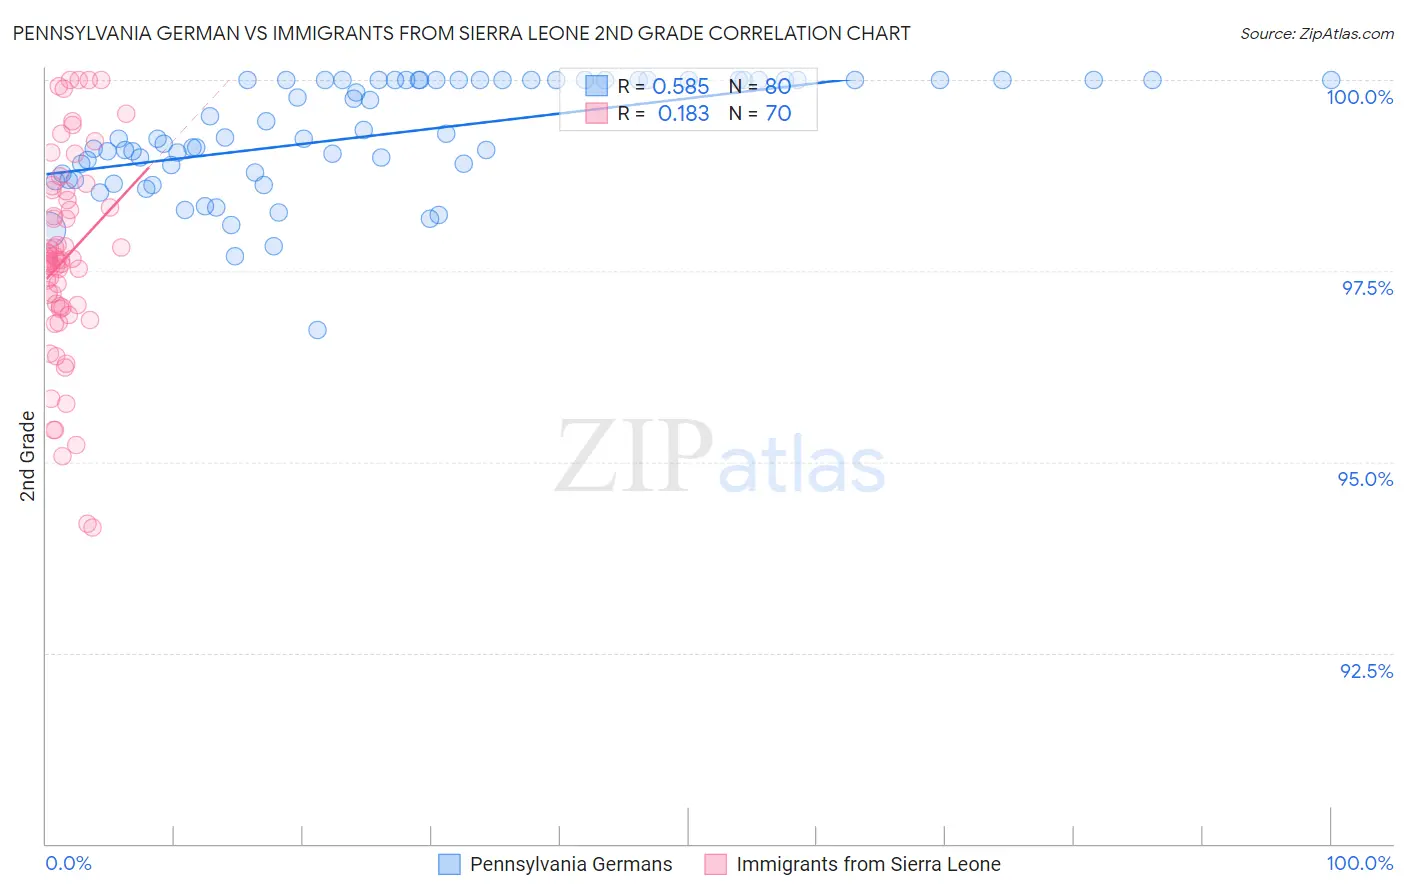
Pennsylvania German vs Immigrants from Sierra Leone 2nd Grade Correlation Chart
The statistical analysis conducted on geographies consisting of 234,102,531 people shows a substantial positive correlation between the proportion of Pennsylvania Germans and percentage of population with at least 2nd grade education in the United States with a correlation coefficient (R) of 0.585 and weighted average of 98.5%. Similarly, the statistical analysis conducted on geographies consisting of 101,634,956 people shows a poor positive correlation between the proportion of Immigrants from Sierra Leone and percentage of population with at least 2nd grade education in the United States with a correlation coefficient (R) of 0.183 and weighted average of 97.4%, a difference of 1.1%.
2nd Grade Correlation Summary
| Measurement | Pennsylvania German | Immigrants from Sierra Leone |
| Minimum | 96.7% | 94.1% |
| Maximum | 100.0% | 100.0% |
| Range | 3.3% | 5.9% |
| Mean | 99.3% | 97.7% |
| Median | 99.2% | 97.6% |
| Interquartile 25% (IQ1) | 98.8% | 97.0% |
| Interquartile 75% (IQ3) | 100.0% | 98.5% |
| Interquartile Range (IQR) | 1.2% | 1.5% |
| Standard Deviation (Sample) | 0.73% | 1.3% |
| Standard Deviation (Population) | 0.73% | 1.3% |
Similar Demographics by 2nd Grade
Demographics Similar to Pennsylvania Germans by 2nd Grade
In terms of 2nd grade, the demographic groups most similar to Pennsylvania Germans are Finnish (98.5%, a difference of 0.0%), Sioux (98.5%, a difference of 0.0%), Lithuanian (98.5%, a difference of 0.0%), Polish (98.5%, a difference of 0.0%), and Danish (98.5%, a difference of 0.0%).
| Demographics | Rating | Rank | 2nd Grade |
| Aleuts | 100.0 /100 | #17 | Exceptional 98.6% |
| Irish | 100.0 /100 | #18 | Exceptional 98.6% |
| Finns | 100.0 /100 | #19 | Exceptional 98.5% |
| Sioux | 100.0 /100 | #20 | Exceptional 98.5% |
| Lithuanians | 100.0 /100 | #21 | Exceptional 98.5% |
| Poles | 100.0 /100 | #22 | Exceptional 98.5% |
| Danes | 100.0 /100 | #23 | Exceptional 98.5% |
| Pennsylvania Germans | 100.0 /100 | #24 | Exceptional 98.5% |
| Scotch-Irish | 100.0 /100 | #25 | Exceptional 98.5% |
| Welsh | 100.0 /100 | #26 | Exceptional 98.5% |
| Croatians | 100.0 /100 | #27 | Exceptional 98.5% |
| Arapaho | 100.0 /100 | #28 | Exceptional 98.5% |
| French | 100.0 /100 | #29 | Exceptional 98.5% |
| Europeans | 100.0 /100 | #30 | Exceptional 98.5% |
| Czechs | 100.0 /100 | #31 | Exceptional 98.5% |
Demographics Similar to Immigrants from Sierra Leone by 2nd Grade
In terms of 2nd grade, the demographic groups most similar to Immigrants from Sierra Leone are Immigrants from Ethiopia (97.4%, a difference of 0.0%), Immigrants from Liberia (97.4%, a difference of 0.0%), Immigrants from South America (97.4%, a difference of 0.0%), Taiwanese (97.4%, a difference of 0.010%), and Fijian (97.5%, a difference of 0.020%).
| Demographics | Rating | Rank | 2nd Grade |
| Fijians | 0.5 /100 | #259 | Tragic 97.5% |
| Assyrians/Chaldeans/Syriacs | 0.5 /100 | #260 | Tragic 97.5% |
| Armenians | 0.5 /100 | #261 | Tragic 97.5% |
| Taiwanese | 0.4 /100 | #262 | Tragic 97.4% |
| Immigrants | Ethiopia | 0.4 /100 | #263 | Tragic 97.4% |
| Immigrants | Liberia | 0.4 /100 | #264 | Tragic 97.4% |
| Immigrants | South America | 0.4 /100 | #265 | Tragic 97.4% |
| Immigrants | Sierra Leone | 0.4 /100 | #266 | Tragic 97.4% |
| Cubans | 0.3 /100 | #267 | Tragic 97.4% |
| Immigrants | Nigeria | 0.3 /100 | #268 | Tragic 97.4% |
| West Indians | 0.3 /100 | #269 | Tragic 97.4% |
| Immigrants | Jamaica | 0.2 /100 | #270 | Tragic 97.4% |
| Immigrants | Cameroon | 0.2 /100 | #271 | Tragic 97.4% |
| Immigrants | Peru | 0.1 /100 | #272 | Tragic 97.4% |
| Immigrants | Bolivia | 0.1 /100 | #273 | Tragic 97.4% |