Nicaraguan vs Chippewa College, Under 1 year
COMPARE
Nicaraguan
Chippewa
College, Under 1 year
College, Under 1 year Comparison
Nicaraguans
Chippewa
59.2%
COLLEGE, UNDER 1 YEAR
0.0/ 100
METRIC RATING
292nd/ 347
METRIC RANK
62.6%
COLLEGE, UNDER 1 YEAR
2.0/ 100
METRIC RATING
234th/ 347
METRIC RANK
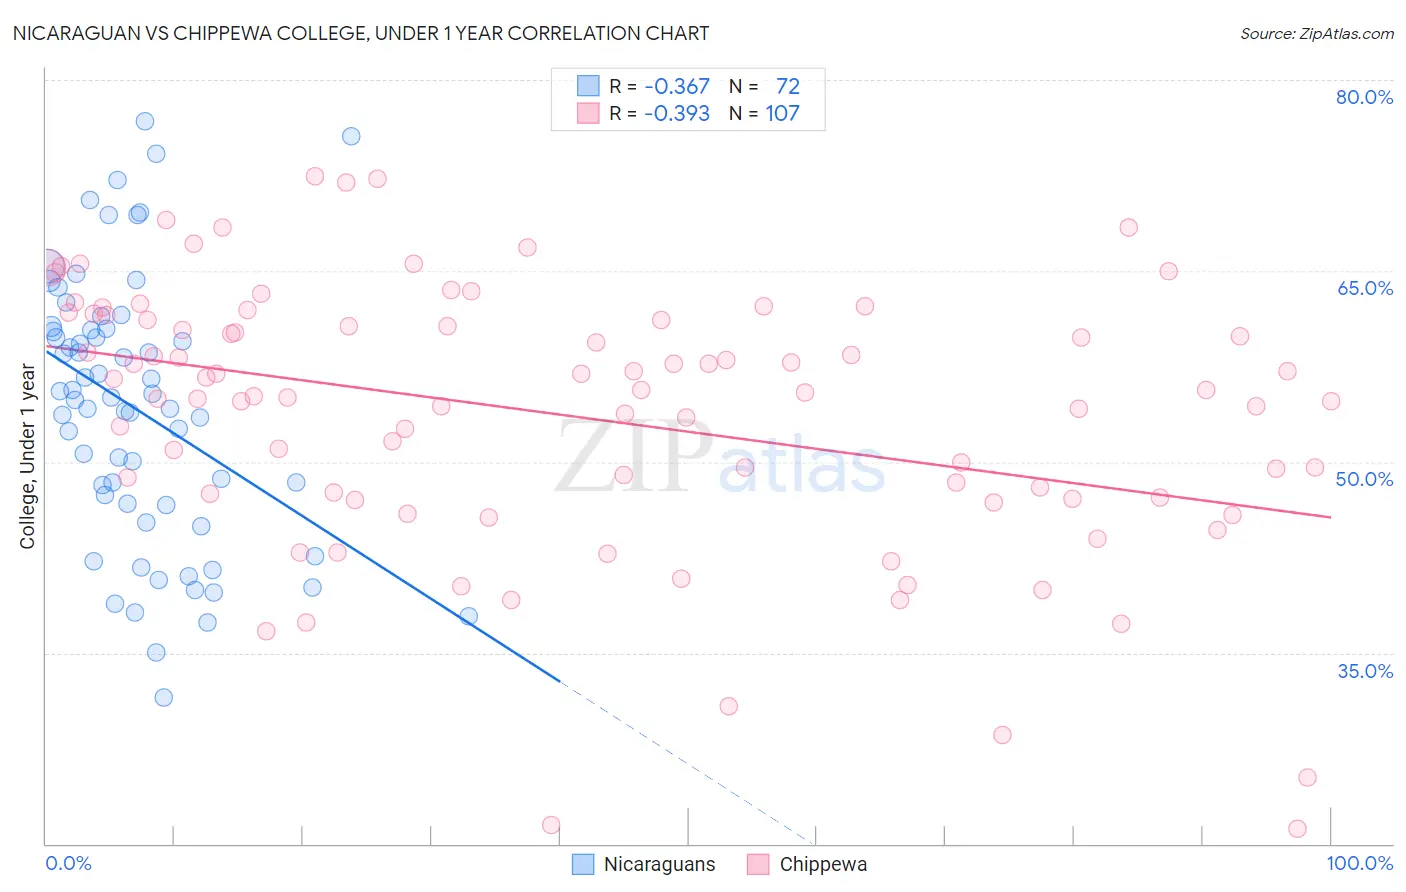
Nicaraguan vs Chippewa College, Under 1 year Correlation Chart
The statistical analysis conducted on geographies consisting of 285,711,556 people shows a mild negative correlation between the proportion of Nicaraguans and percentage of population with at least college, under 1 year education in the United States with a correlation coefficient (R) of -0.367 and weighted average of 59.2%. Similarly, the statistical analysis conducted on geographies consisting of 215,068,018 people shows a mild negative correlation between the proportion of Chippewa and percentage of population with at least college, under 1 year education in the United States with a correlation coefficient (R) of -0.393 and weighted average of 62.6%, a difference of 5.7%.
College, Under 1 year Correlation Summary
| Measurement | Nicaraguan | Chippewa |
| Minimum | 31.5% | 21.2% |
| Maximum | 76.7% | 72.5% |
| Range | 45.3% | 51.3% |
| Mean | 54.1% | 53.6% |
| Median | 55.0% | 55.5% |
| Interquartile 25% (IQ1) | 46.7% | 47.2% |
| Interquartile 75% (IQ3) | 60.4% | 61.1% |
| Interquartile Range (IQR) | 13.7% | 14.0% |
| Standard Deviation (Sample) | 10.4% | 10.5% |
| Standard Deviation (Population) | 10.4% | 10.5% |
Similar Demographics by College, Under 1 year
Demographics Similar to Nicaraguans by College, Under 1 year
In terms of college, under 1 year, the demographic groups most similar to Nicaraguans are Creek (59.3%, a difference of 0.040%), Ecuadorian (59.3%, a difference of 0.13%), Choctaw (59.3%, a difference of 0.17%), Seminole (59.1%, a difference of 0.18%), and Immigrants from Belize (59.1%, a difference of 0.20%).
| Demographics | Rating | Rank | College, Under 1 year |
| Paiute | 0.0 /100 | #285 | Tragic 59.6% |
| British West Indians | 0.0 /100 | #286 | Tragic 59.5% |
| Sioux | 0.0 /100 | #287 | Tragic 59.4% |
| Blacks/African Americans | 0.0 /100 | #288 | Tragic 59.4% |
| Choctaw | 0.0 /100 | #289 | Tragic 59.3% |
| Ecuadorians | 0.0 /100 | #290 | Tragic 59.3% |
| Creek | 0.0 /100 | #291 | Tragic 59.3% |
| Nicaraguans | 0.0 /100 | #292 | Tragic 59.2% |
| Seminole | 0.0 /100 | #293 | Tragic 59.1% |
| Immigrants | Belize | 0.0 /100 | #294 | Tragic 59.1% |
| Immigrants | Grenada | 0.0 /100 | #295 | Tragic 59.1% |
| Central American Indians | 0.0 /100 | #296 | Tragic 59.0% |
| Guyanese | 0.0 /100 | #297 | Tragic 59.0% |
| Immigrants | Ecuador | 0.0 /100 | #298 | Tragic 58.7% |
| Cubans | 0.0 /100 | #299 | Tragic 58.6% |
Demographics Similar to Chippewa by College, Under 1 year
In terms of college, under 1 year, the demographic groups most similar to Chippewa are Iroquois (62.6%, a difference of 0.030%), Spanish American (62.6%, a difference of 0.050%), Osage (62.7%, a difference of 0.15%), Immigrants (62.5%, a difference of 0.18%), and Immigrants from Burma/Myanmar (62.5%, a difference of 0.21%).
| Demographics | Rating | Rank | College, Under 1 year |
| Immigrants | Ghana | 3.7 /100 | #227 | Tragic 63.1% |
| Samoans | 3.3 /100 | #228 | Tragic 63.0% |
| Liberians | 3.2 /100 | #229 | Tragic 63.0% |
| Immigrants | Nonimmigrants | 3.0 /100 | #230 | Tragic 62.9% |
| Immigrants | Western Africa | 2.4 /100 | #231 | Tragic 62.8% |
| Osage | 2.2 /100 | #232 | Tragic 62.7% |
| Iroquois | 2.0 /100 | #233 | Tragic 62.6% |
| Chippewa | 2.0 /100 | #234 | Tragic 62.6% |
| Spanish Americans | 1.9 /100 | #235 | Tragic 62.6% |
| Immigrants | Immigrants | 1.7 /100 | #236 | Tragic 62.5% |
| Immigrants | Burma/Myanmar | 1.6 /100 | #237 | Tragic 62.5% |
| French American Indians | 1.5 /100 | #238 | Tragic 62.4% |
| Nepalese | 1.1 /100 | #239 | Tragic 62.2% |
| Aleuts | 1.1 /100 | #240 | Tragic 62.2% |
| Ottawa | 1.1 /100 | #241 | Tragic 62.2% |